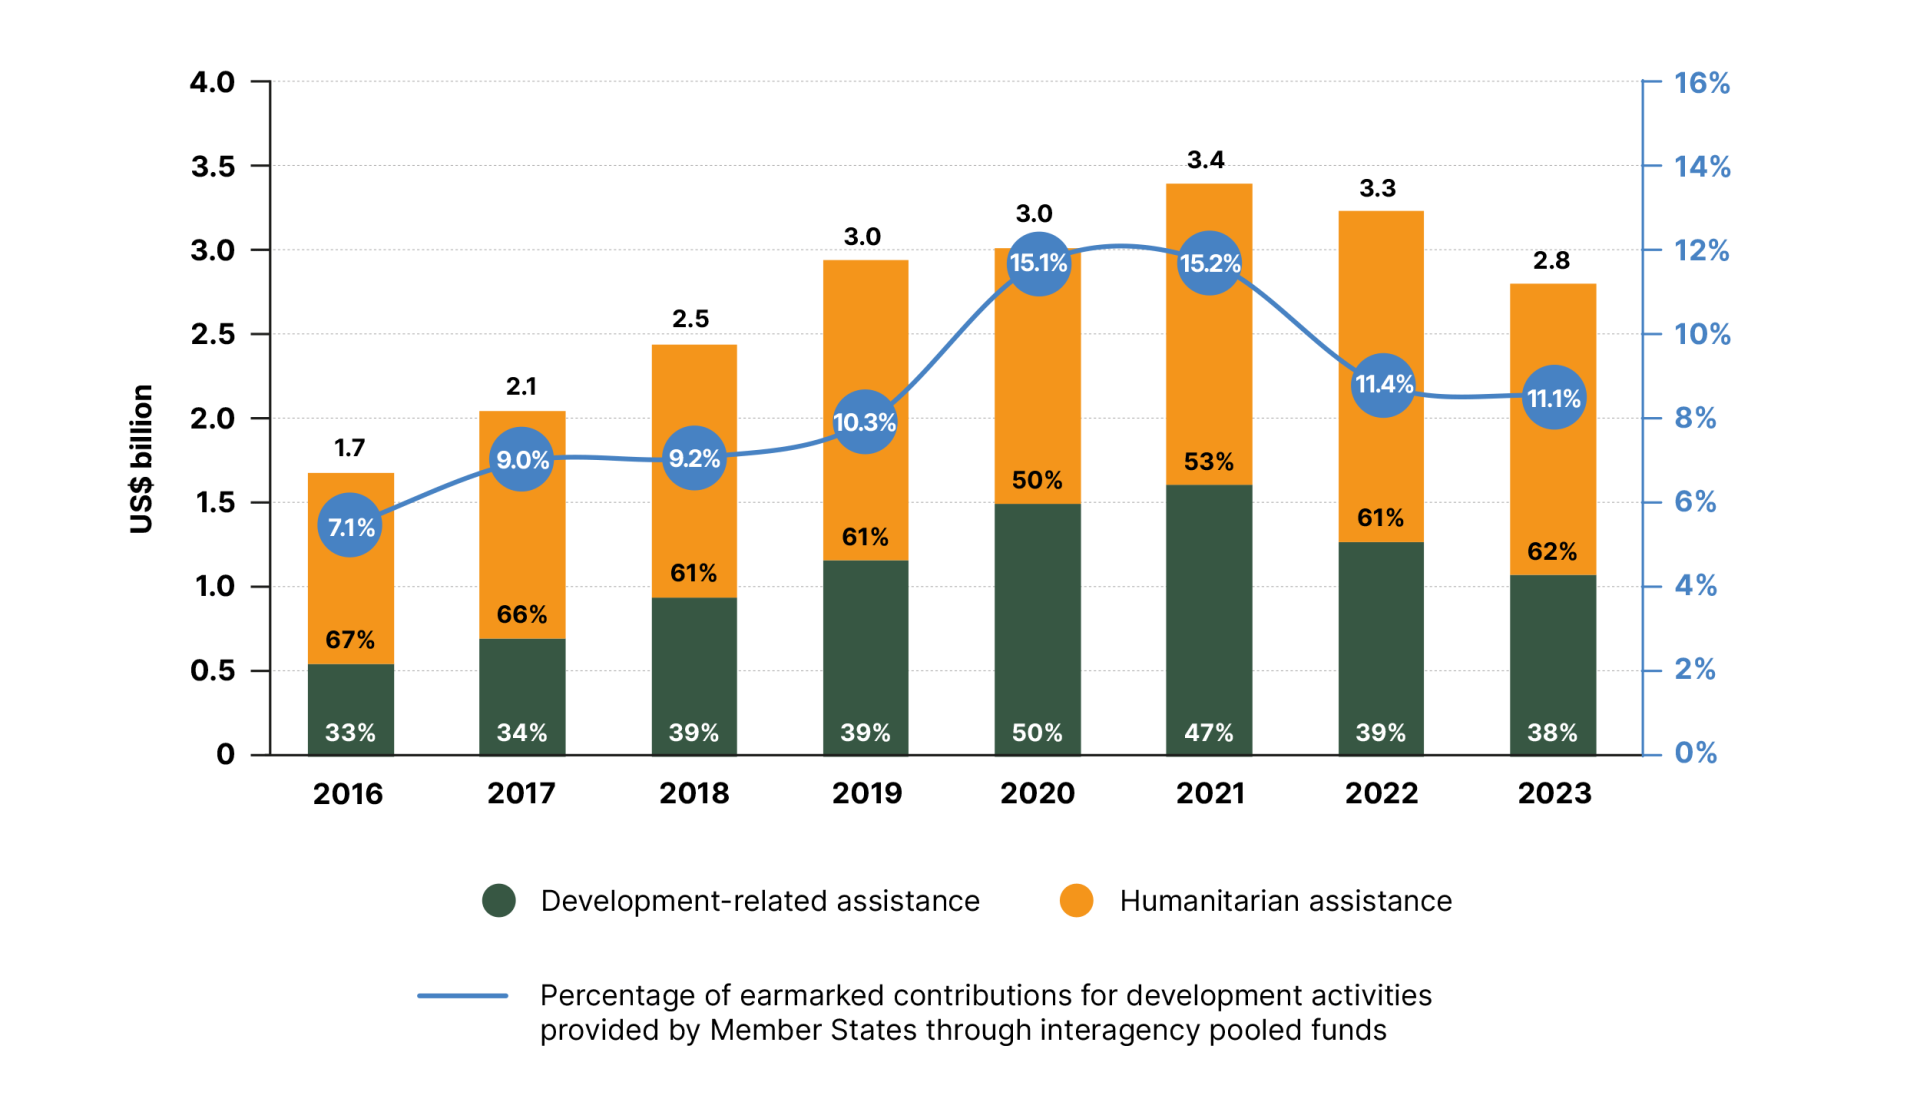
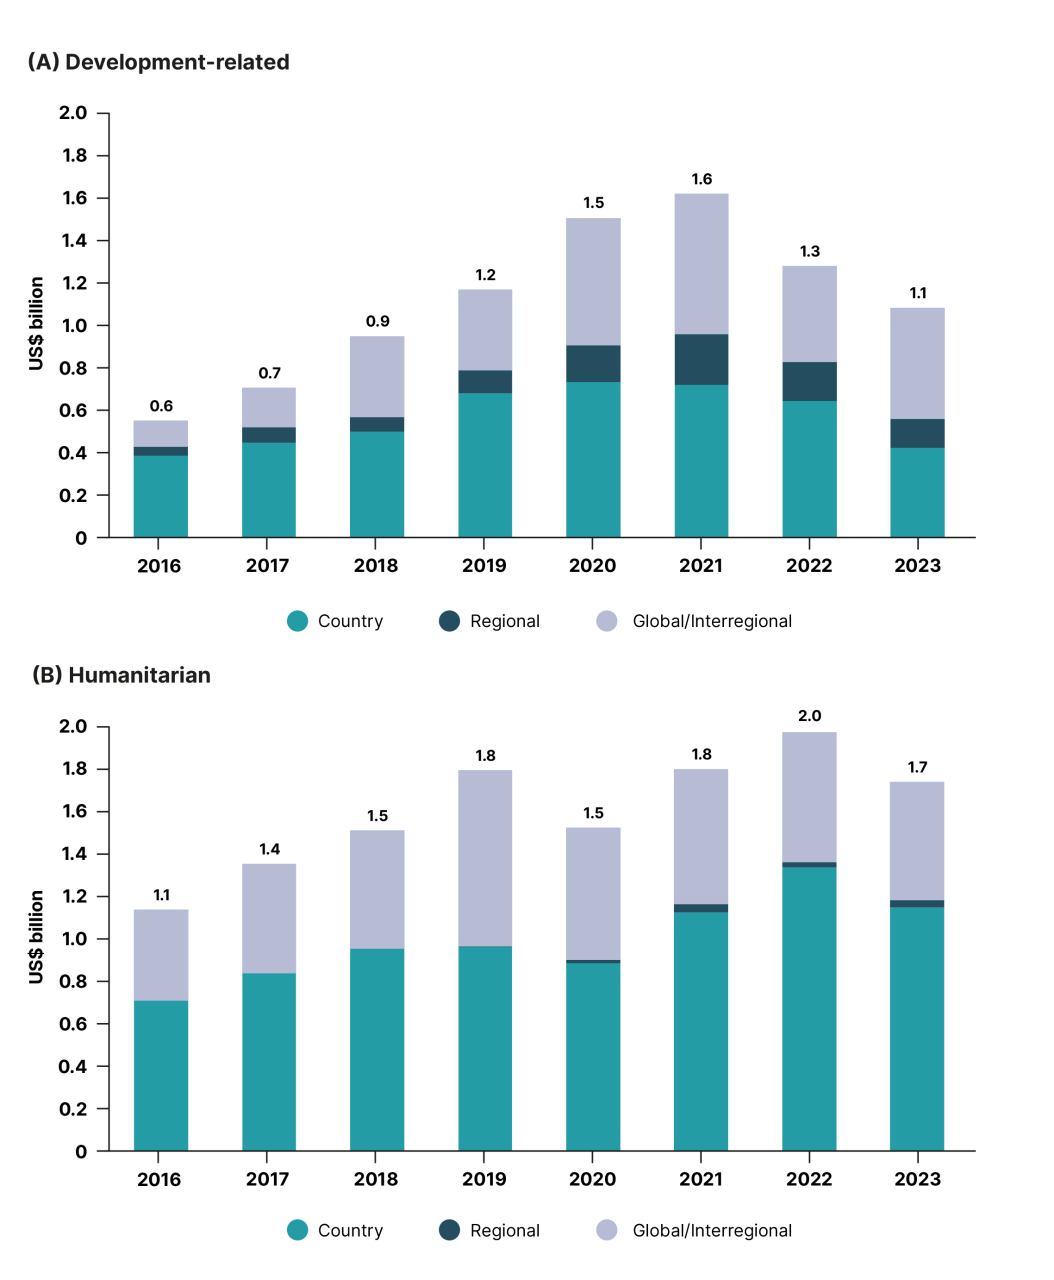
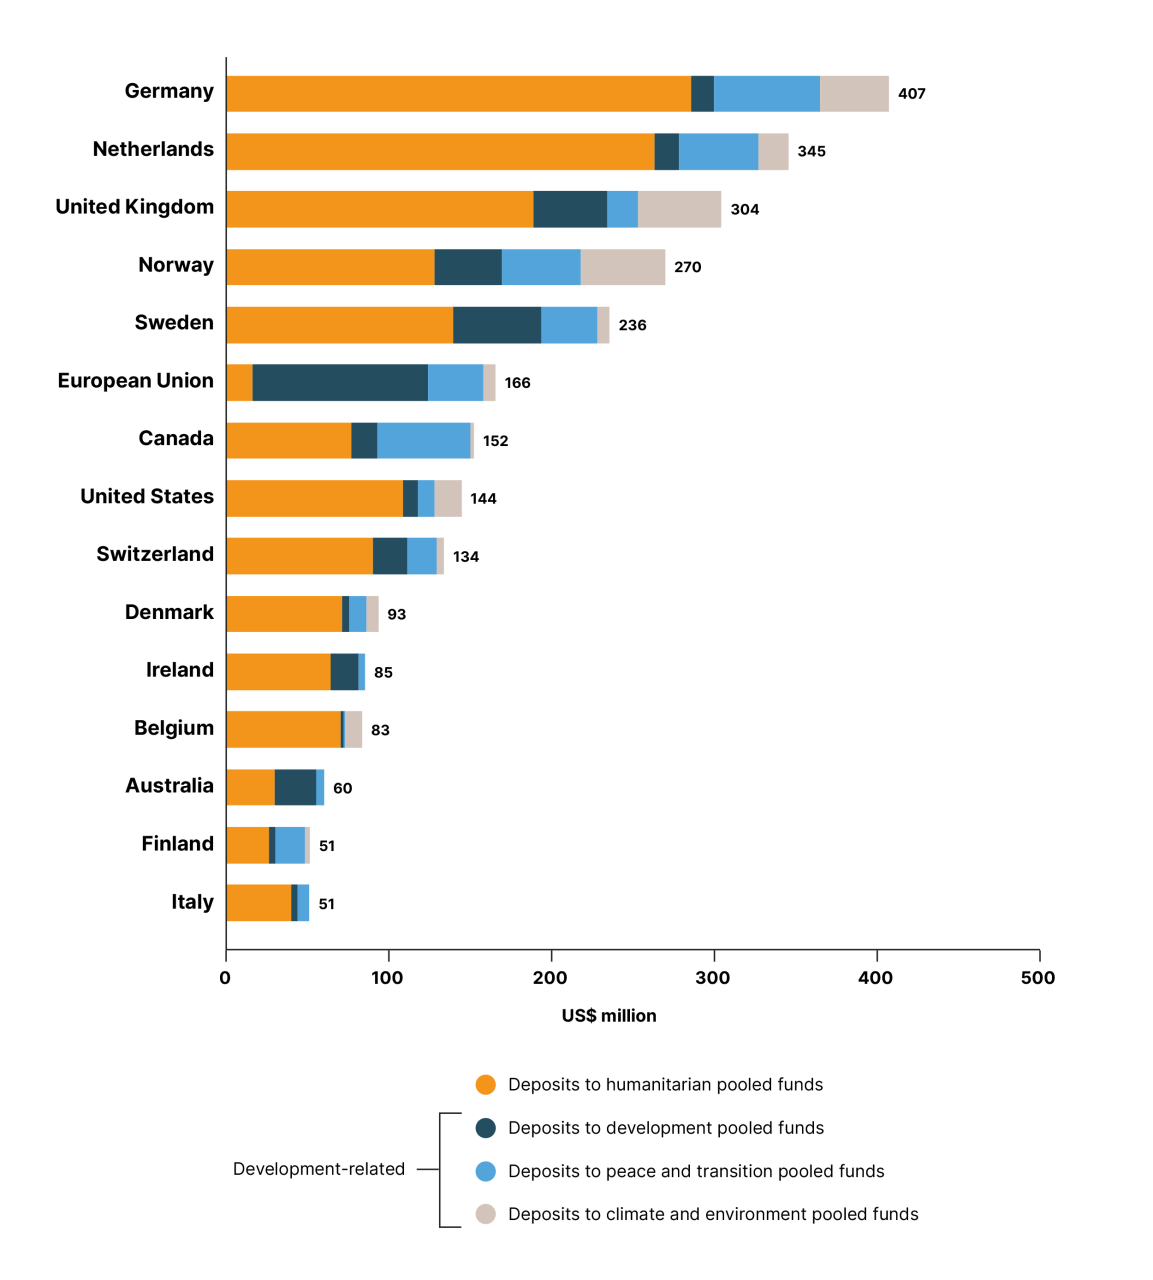
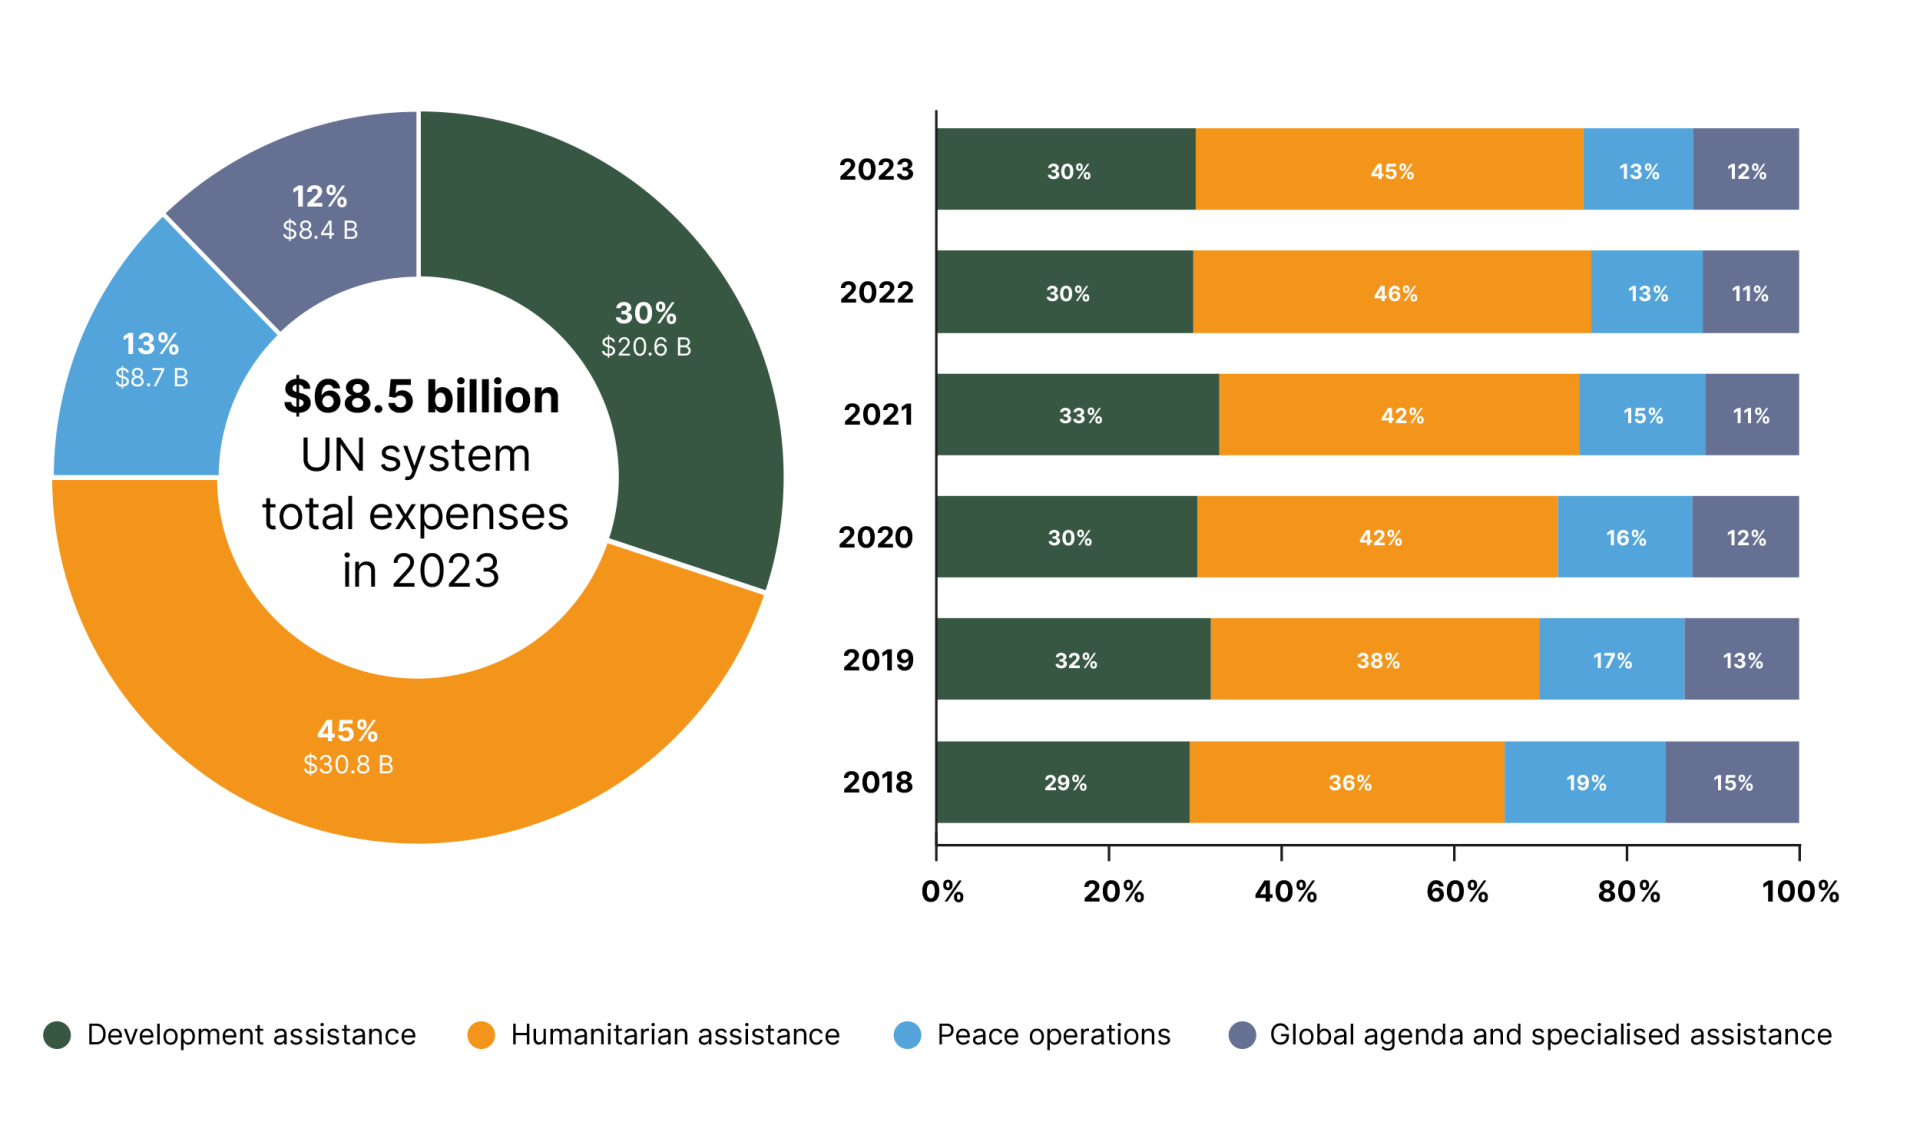
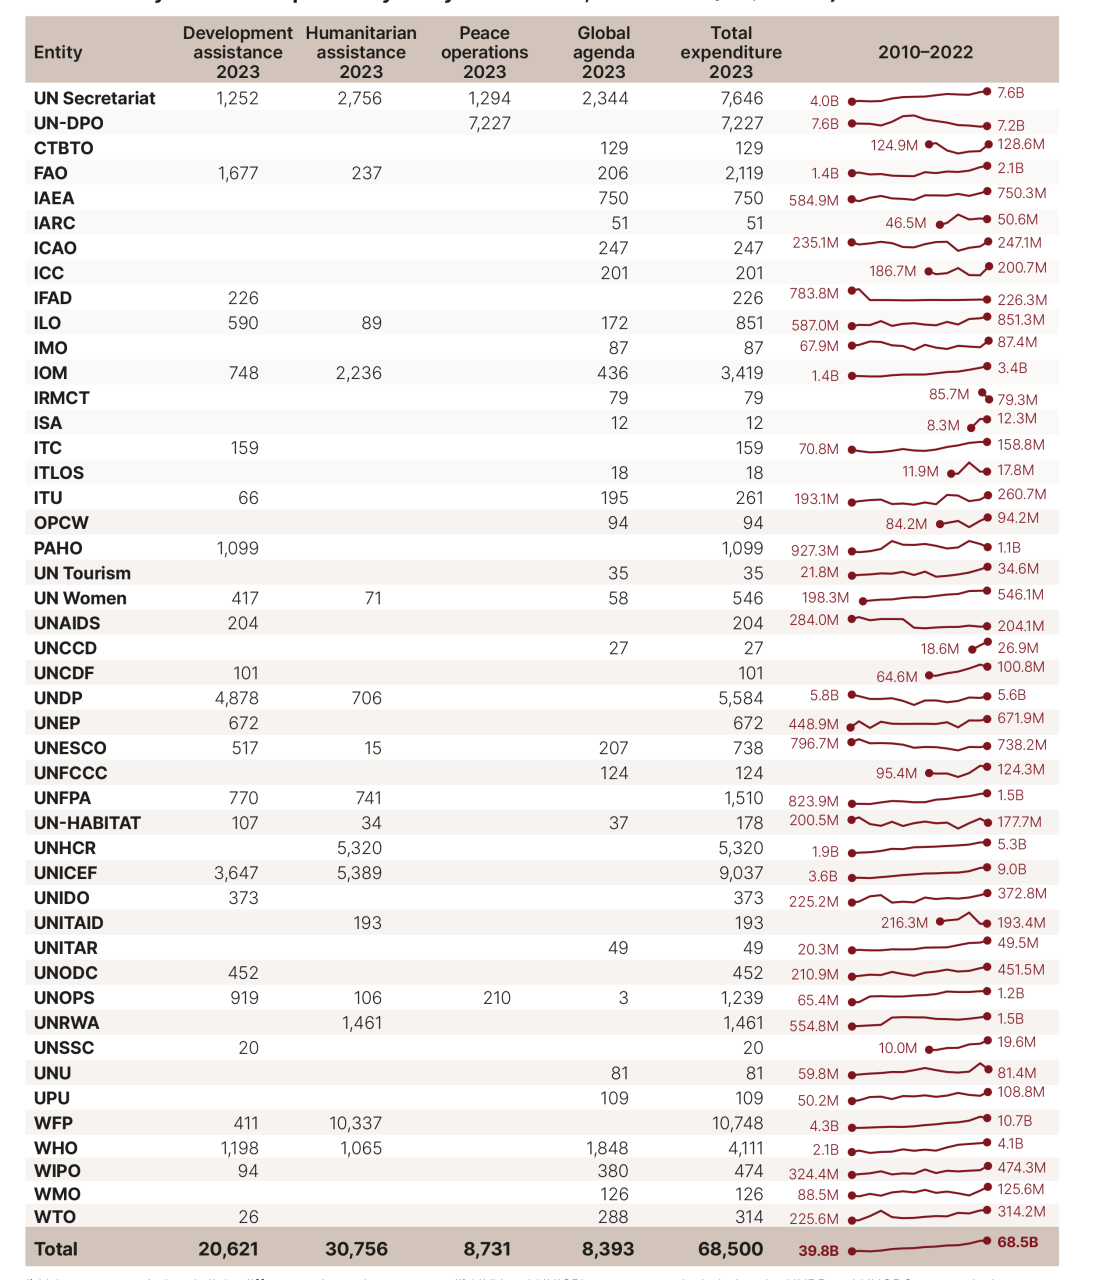
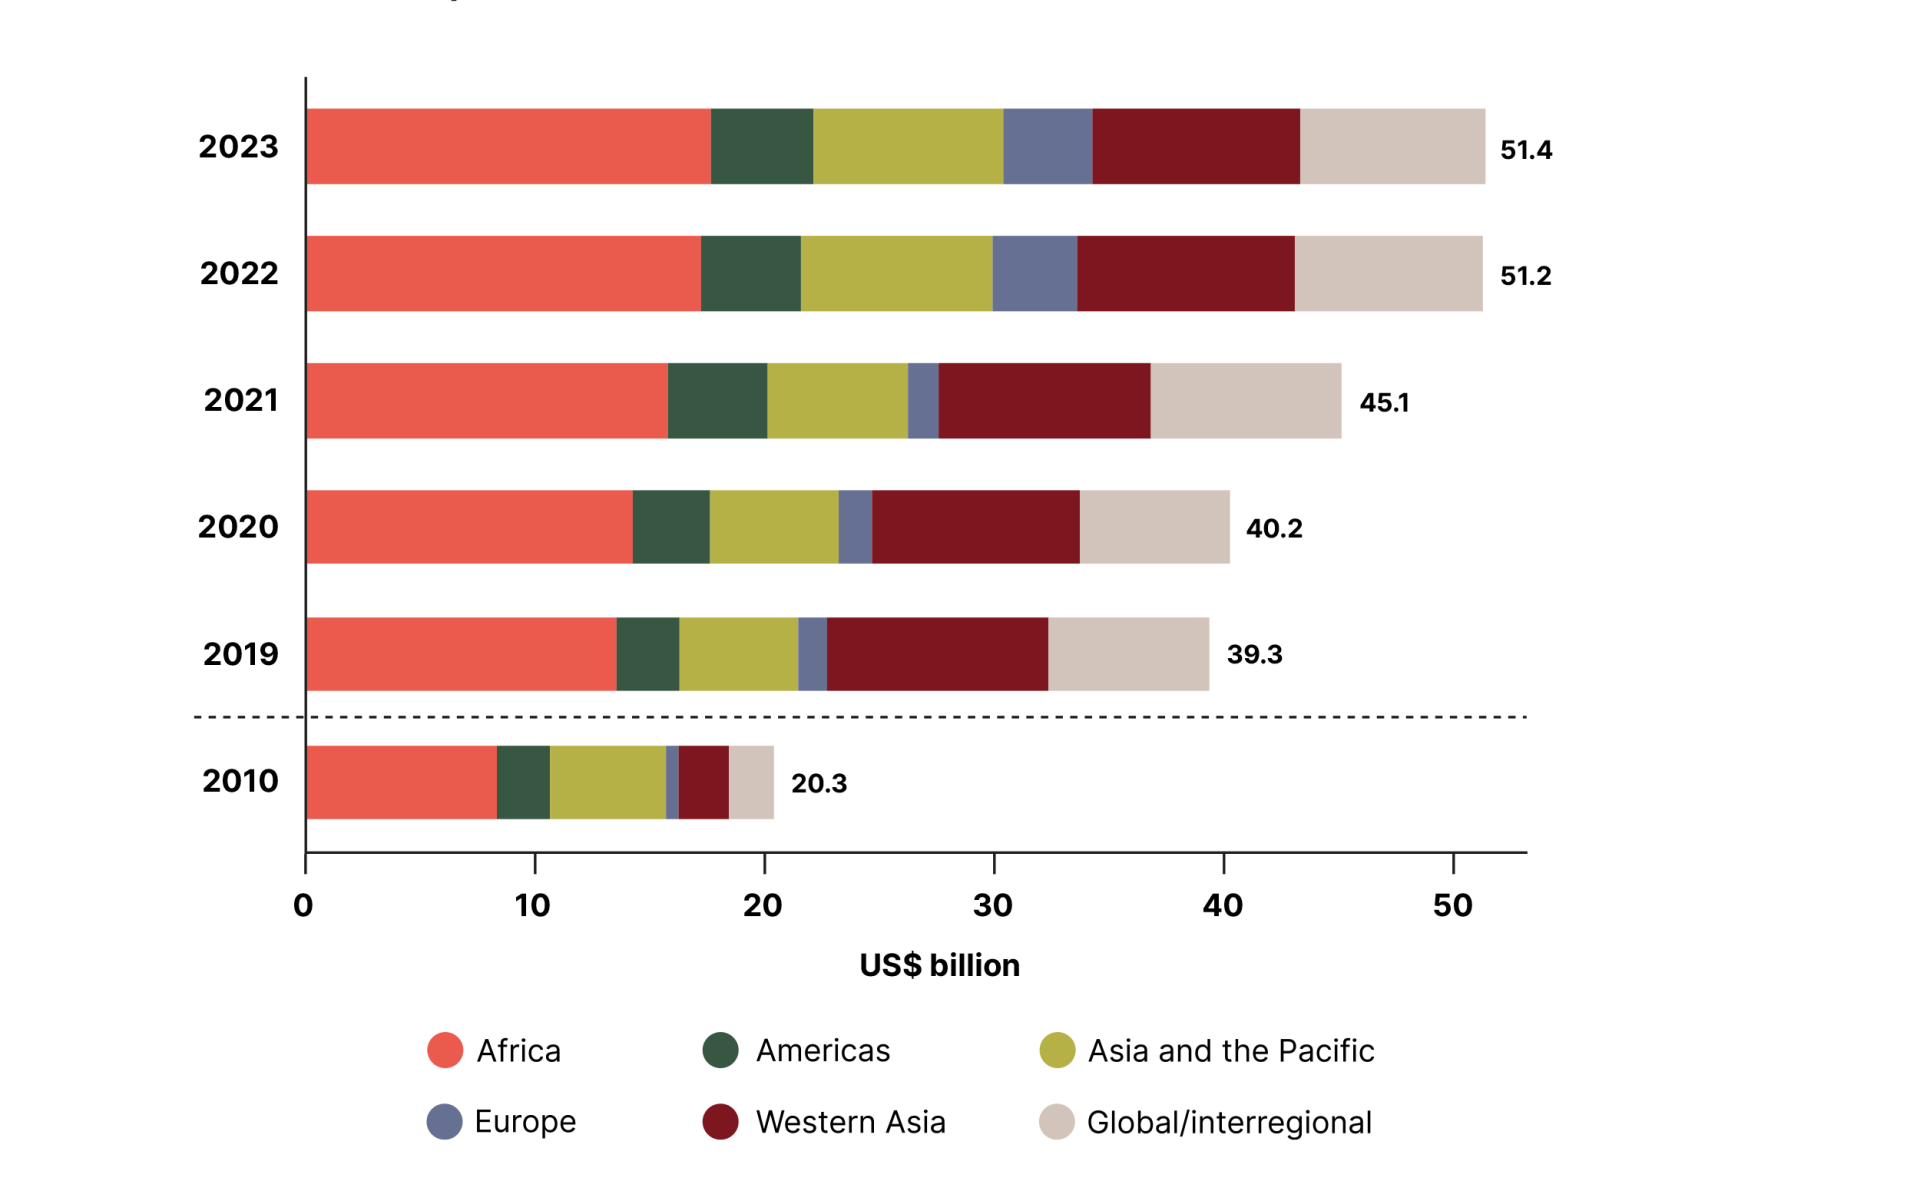
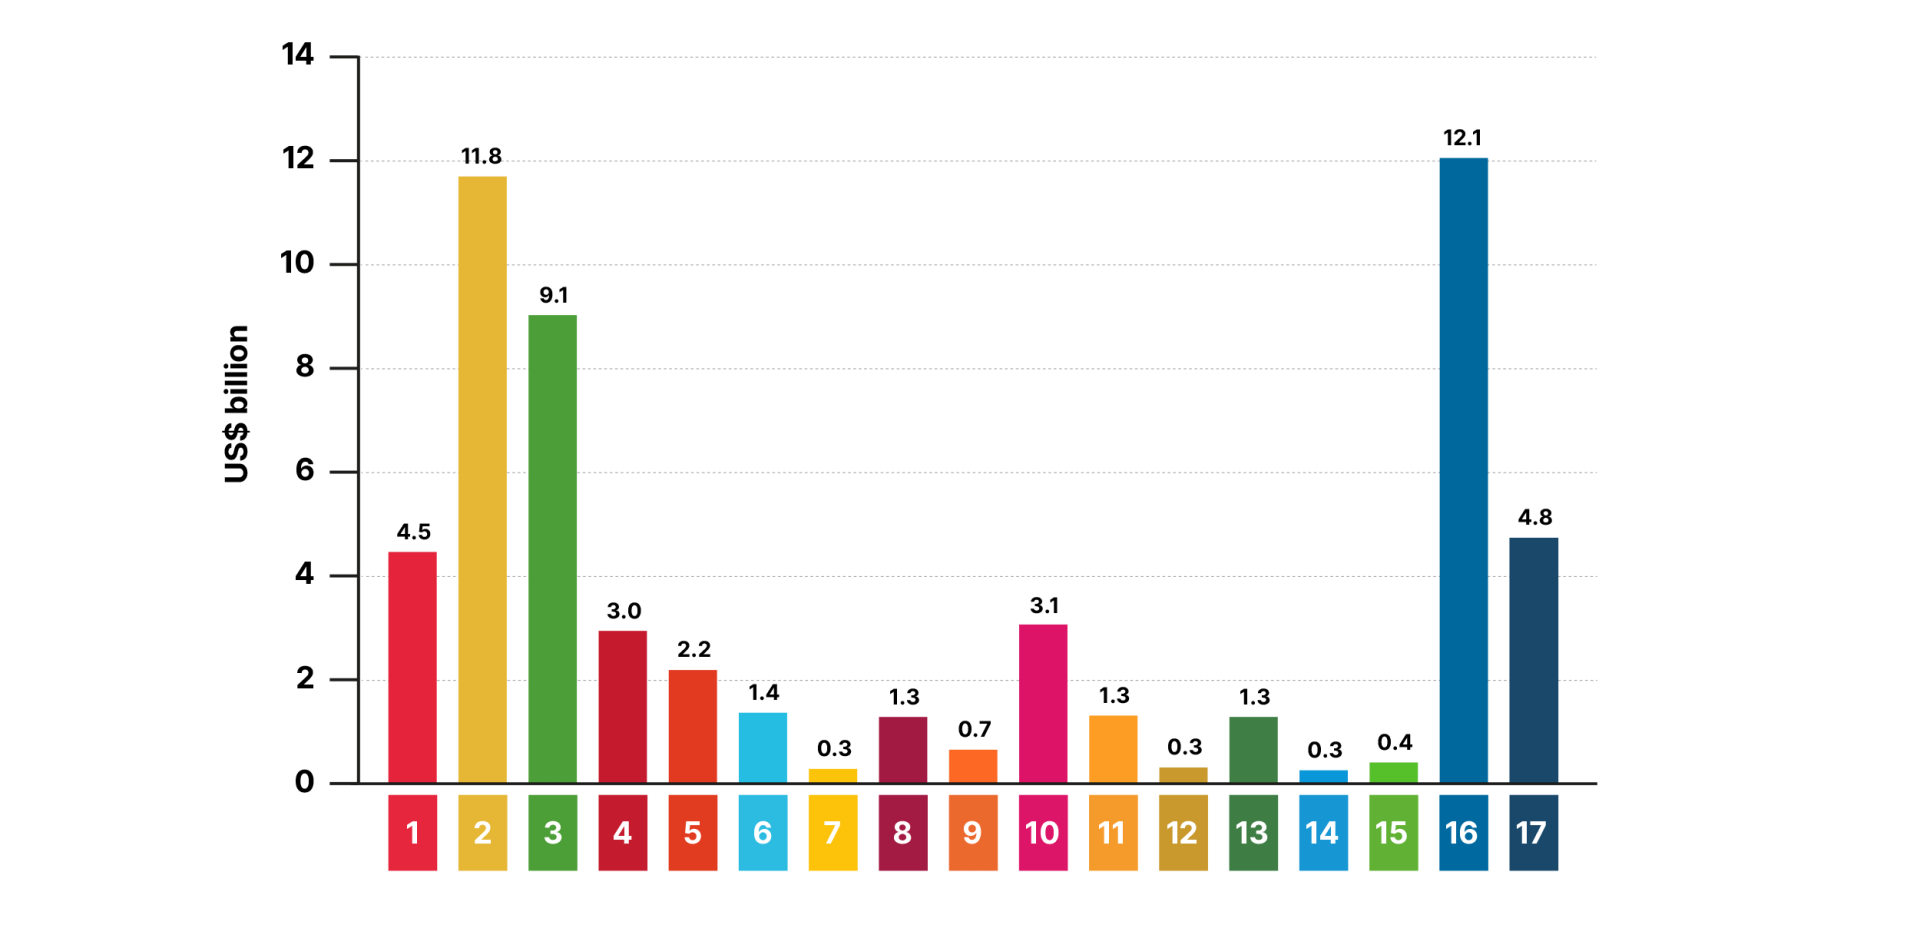
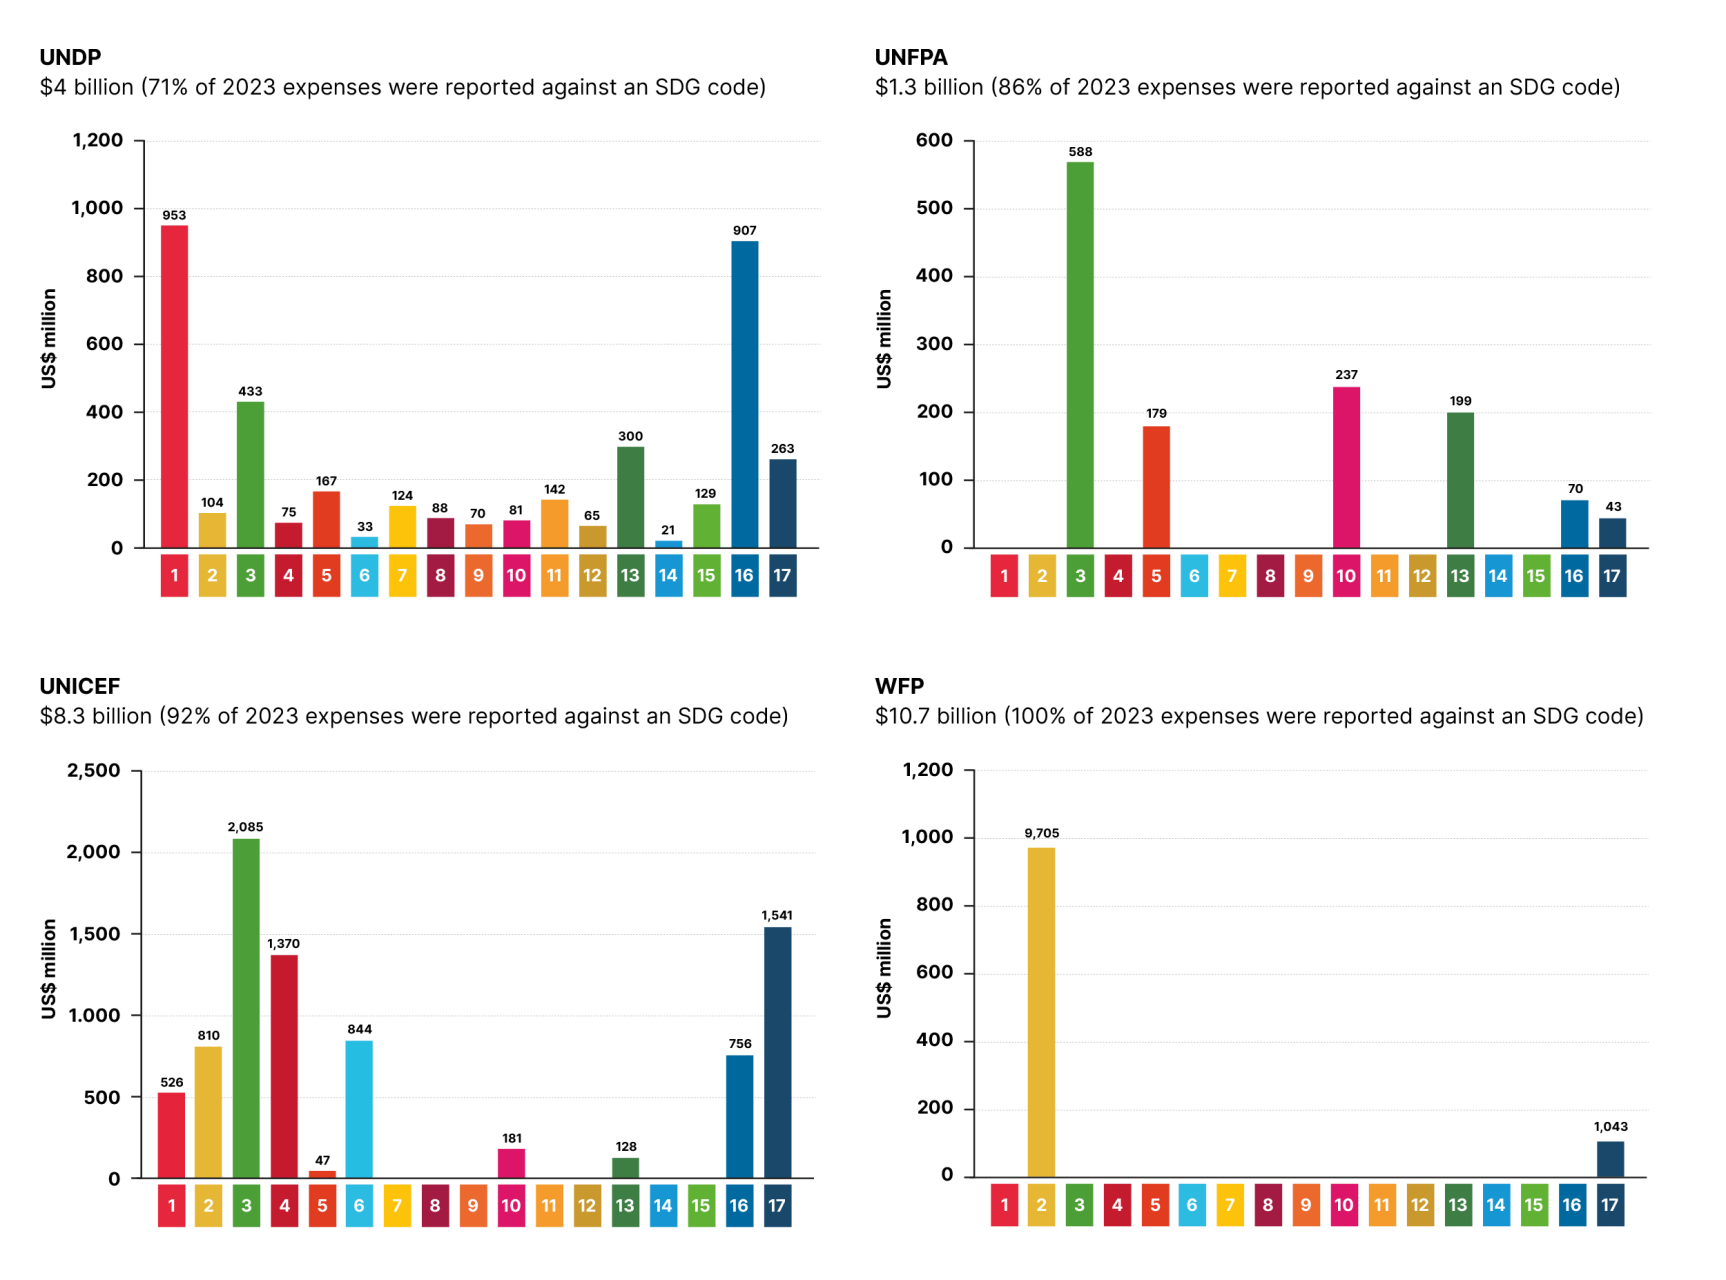
Explore the data Figures and tables Taking data quality to the next level Filter Year20252024202320222021 Figure 18 Contributions to UN Inter-agency pooled funds, 2016–2023 (US$ billion) Figure 19 Contributions to UN inter-agency pooled funds by geographic scope, 2016–2023 (US$ billion) Figure 20 Contributions to UN inter-agency pooled funds: Top contributors, 2023 (US$ million) Figure 21 Countries contributing more than 10% of their earmarked funding to UN development assistance through UN inter-agency pooled funds, 2023 Figure 22 Top implementing UN entities receiving resources through UN inter-agency pooled funds, by fund thematic area Figure 23 Top UN inter-agency pooled funds recipient countries or areas, 2023 (US$ million) Figure 24 Countries or areas where more than 15% of earmarked resources is channelled through development-related UN inter-agency pooled funds, 2023 Figure 25 OECD-DAC countries use of the multilateral development system, 2011–2023 (US$ billion, constant 2022 prices) Figure 26 Channels of multilateral assistance from OECD-DAC countries, core and earmarked, 2011 and 2023 (US$ billion, constant 2022 prices) Figure 27 Expenses of the UN system by function, 2018–2023 Table 4 UN system total expenses by entity and function, 2010-2023 (US$ million) Figure 28 Total UN expenses for development and humanitarian assistance, 2010–2023 (US$ billion) Figure 29 Total expenses for development and humanitarian assistance by select UN entities, 2015–2024 (US$ billion) Figure 30 Expenses on UN humanitarian and development assistance by region, 2010–2023 (US$ billion) Figure 31 Development, humanitarian and peace by region, 2010-2023 (US$ billion) Figure 32 UN development, humanitarian, and peace operations expenses by crisis-affected country, 2023 (US$ billion) Figure 33 UN development and humanitarian expenses in UN programming countries by income status, 2023 (US$ billion) Figure 34 UN development and humanitarian expenses in least developed countries, 2016–2023 (US$ billion) Figure 35 Aggregated UN expenses linked to the SDGs, 2023 (US$ billion) Figure 36 Expenses linked to SDGs of select UN entities, 2023 (US$ million) Pagination First page « First Previous page ‹ Previous Page 1 Current page 2 Page 3 Next page Next › Last page Last »
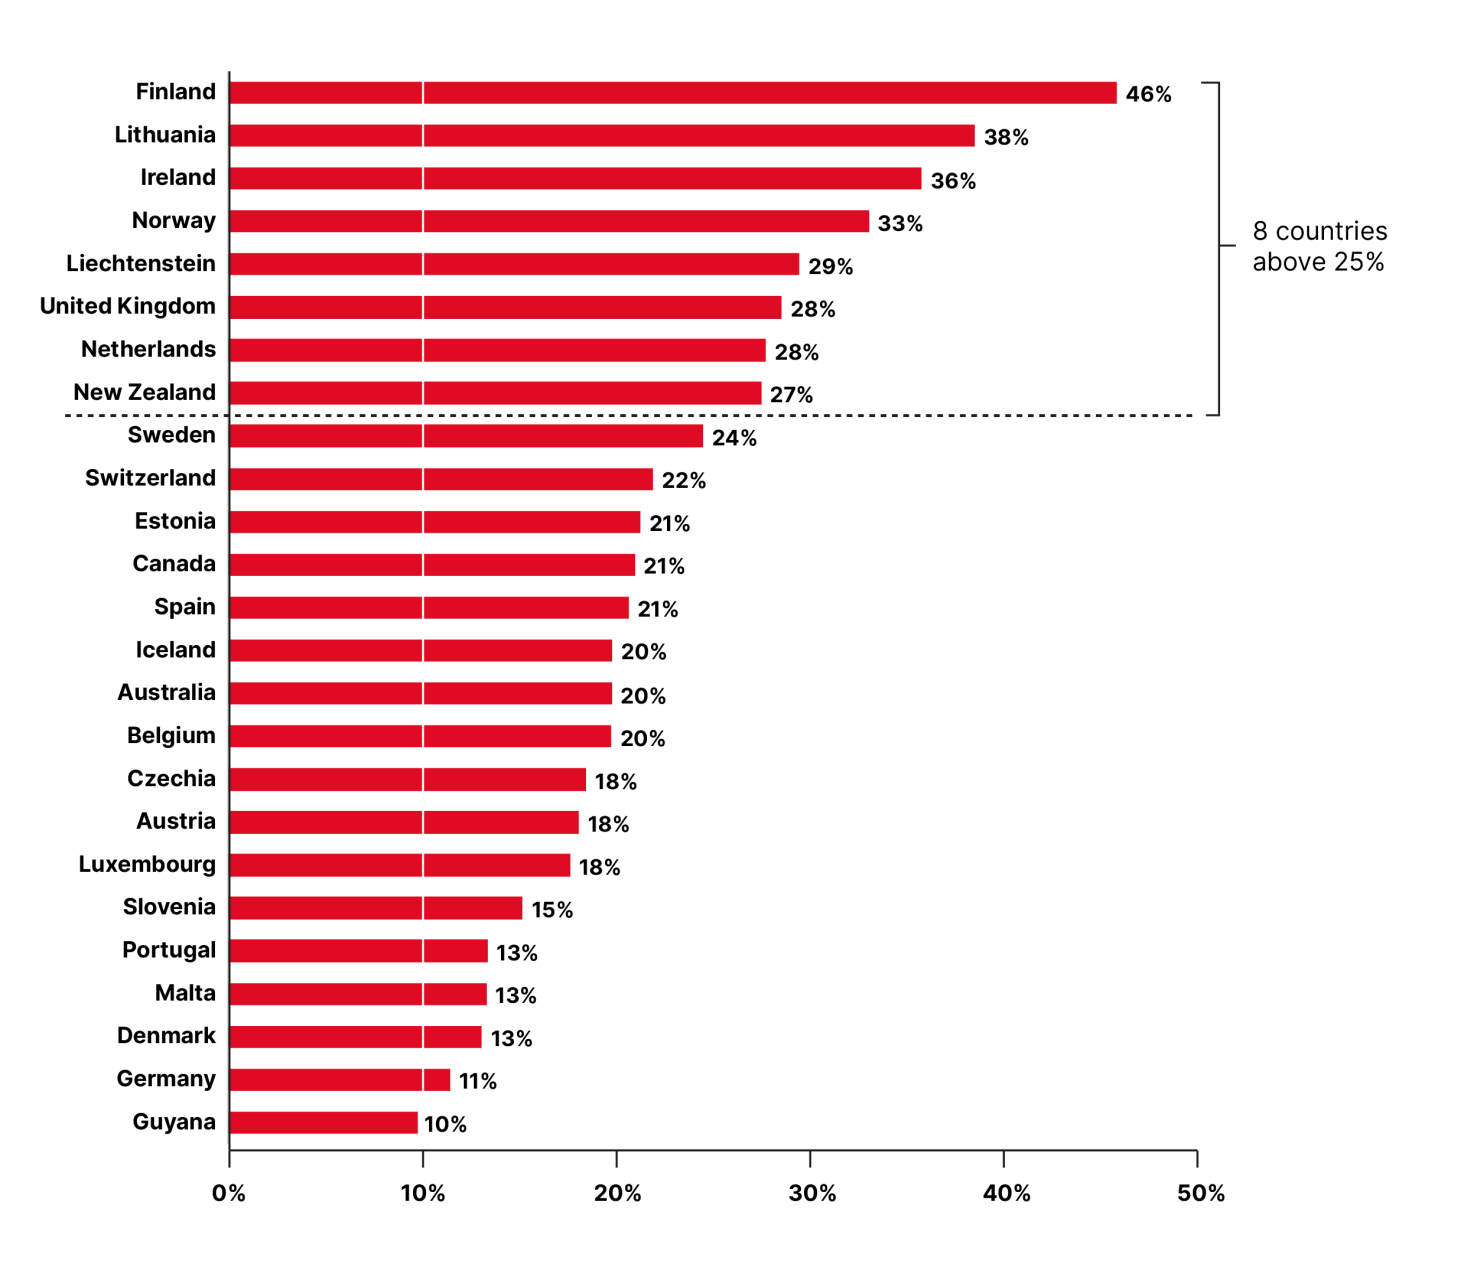
Figure 21 Countries contributing more than 10% of their earmarked funding to UN development assistance through UN inter-agency pooled funds, 2023
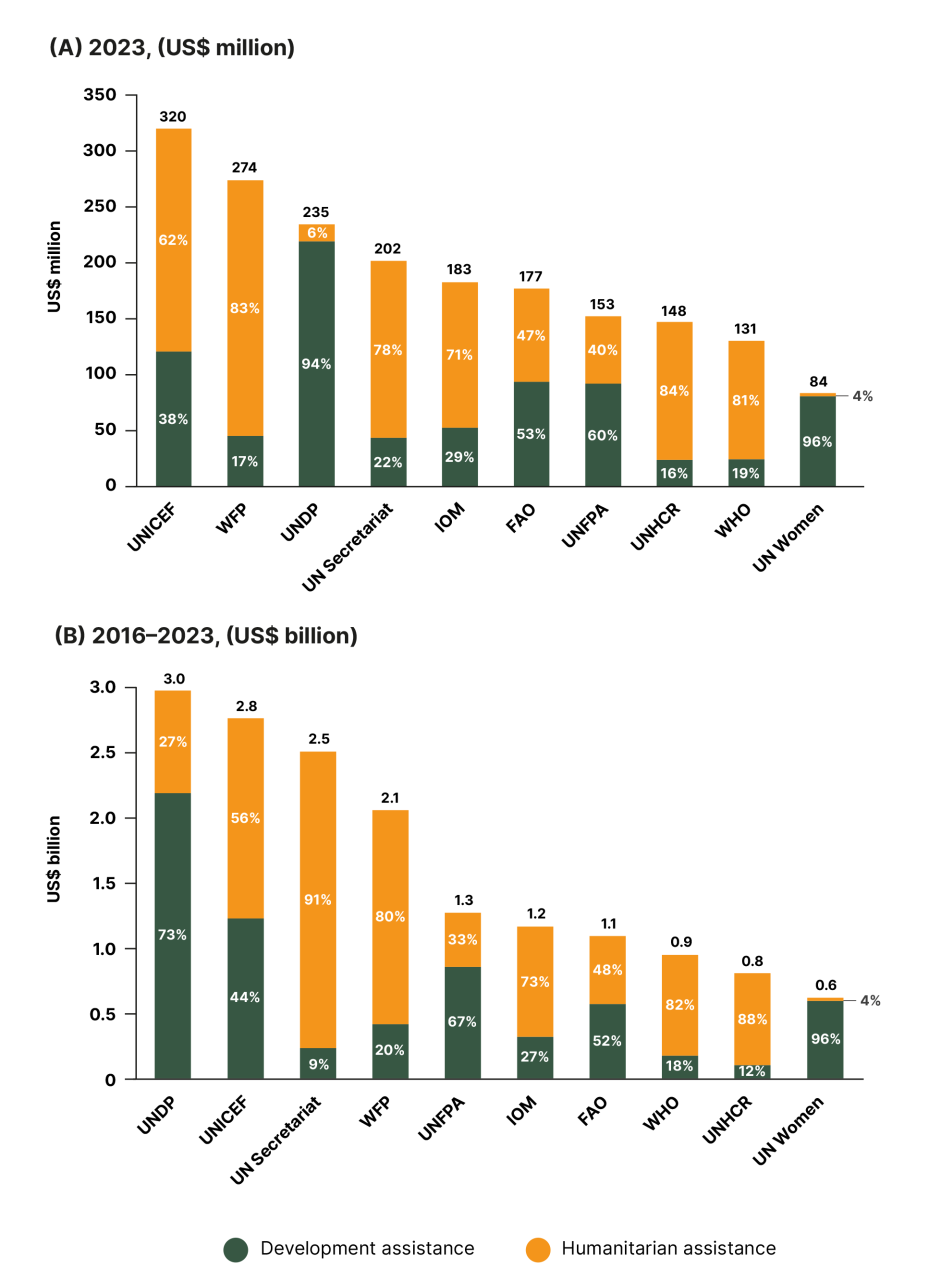
Figure 22 Top implementing UN entities receiving resources through UN inter-agency pooled funds, by fund thematic area
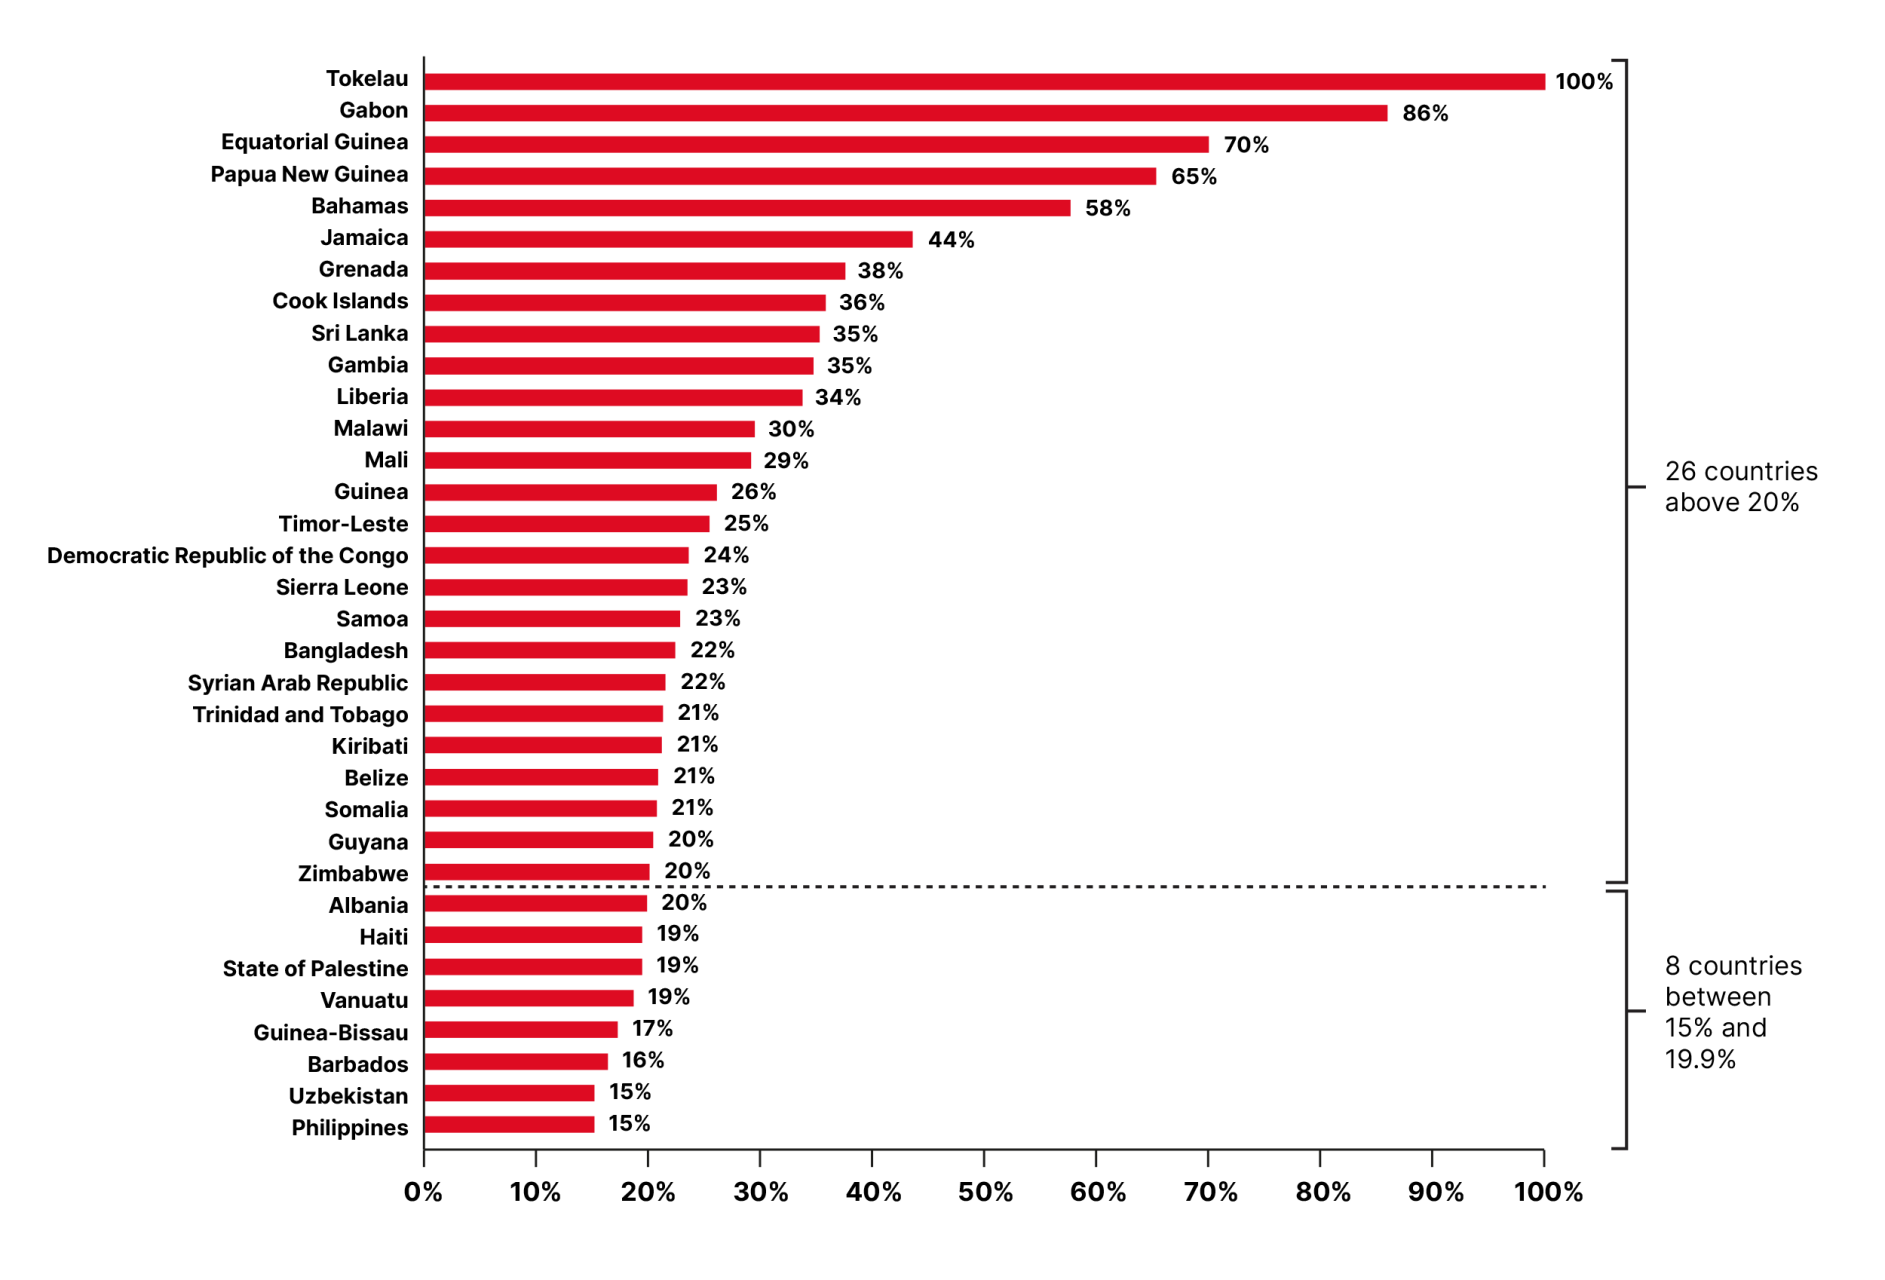
Figure 24 Countries or areas where more than 15% of earmarked resources is channelled through development-related UN inter-agency pooled funds, 2023
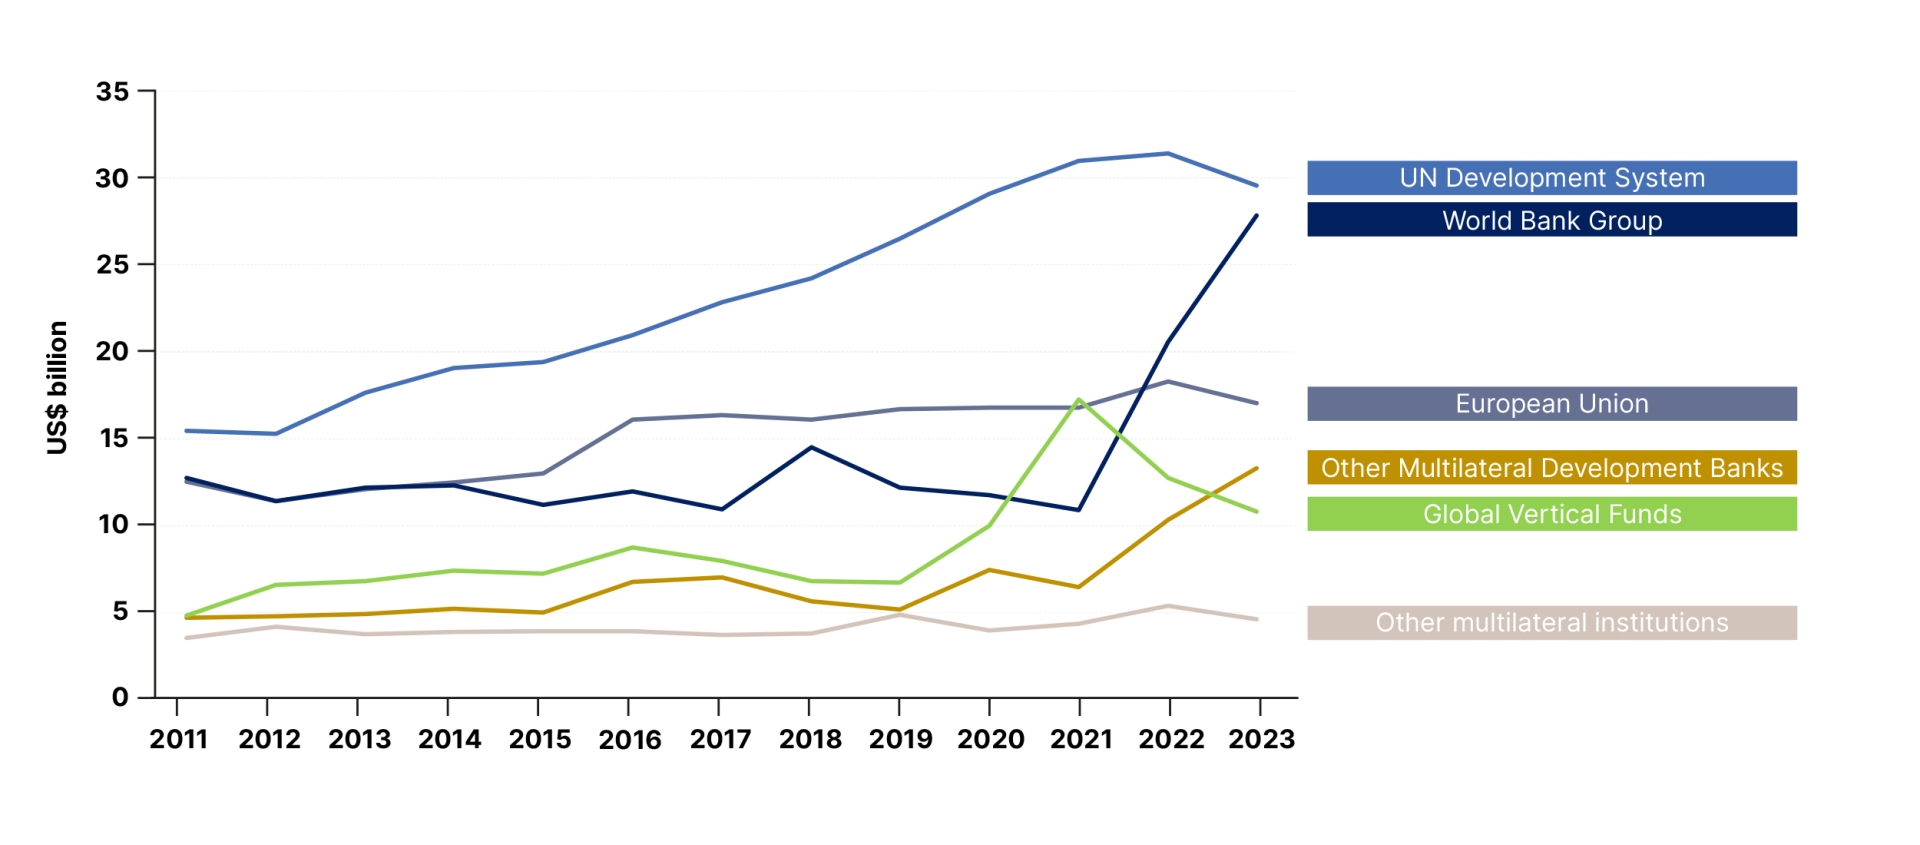
Figure 25 OECD-DAC countries use of the multilateral development system, 2011–2023 (US$ billion, constant 2022 prices)
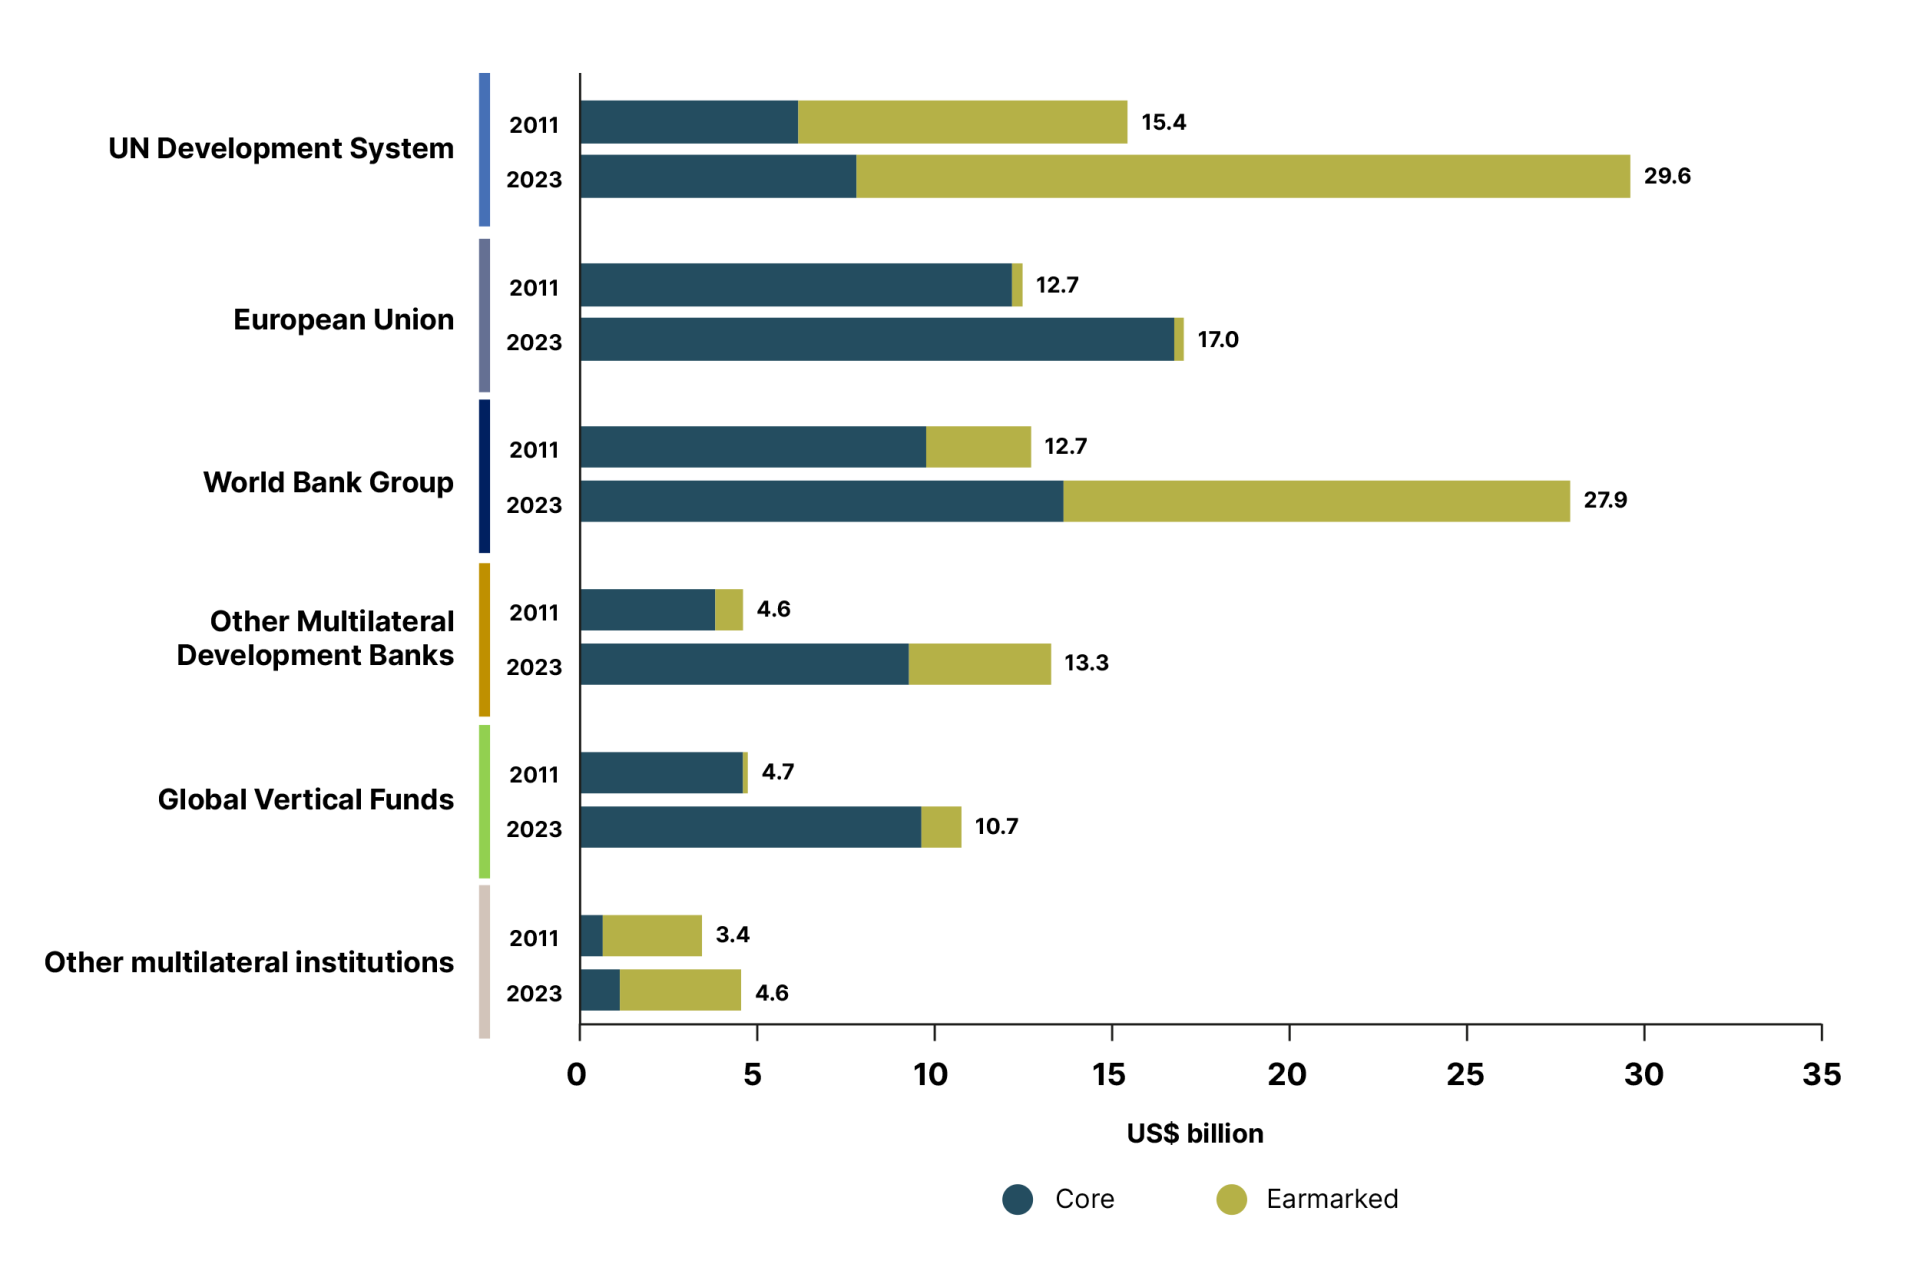
Figure 26 Channels of multilateral assistance from OECD-DAC countries, core and earmarked, 2011 and 2023 (US$ billion, constant 2022 prices)
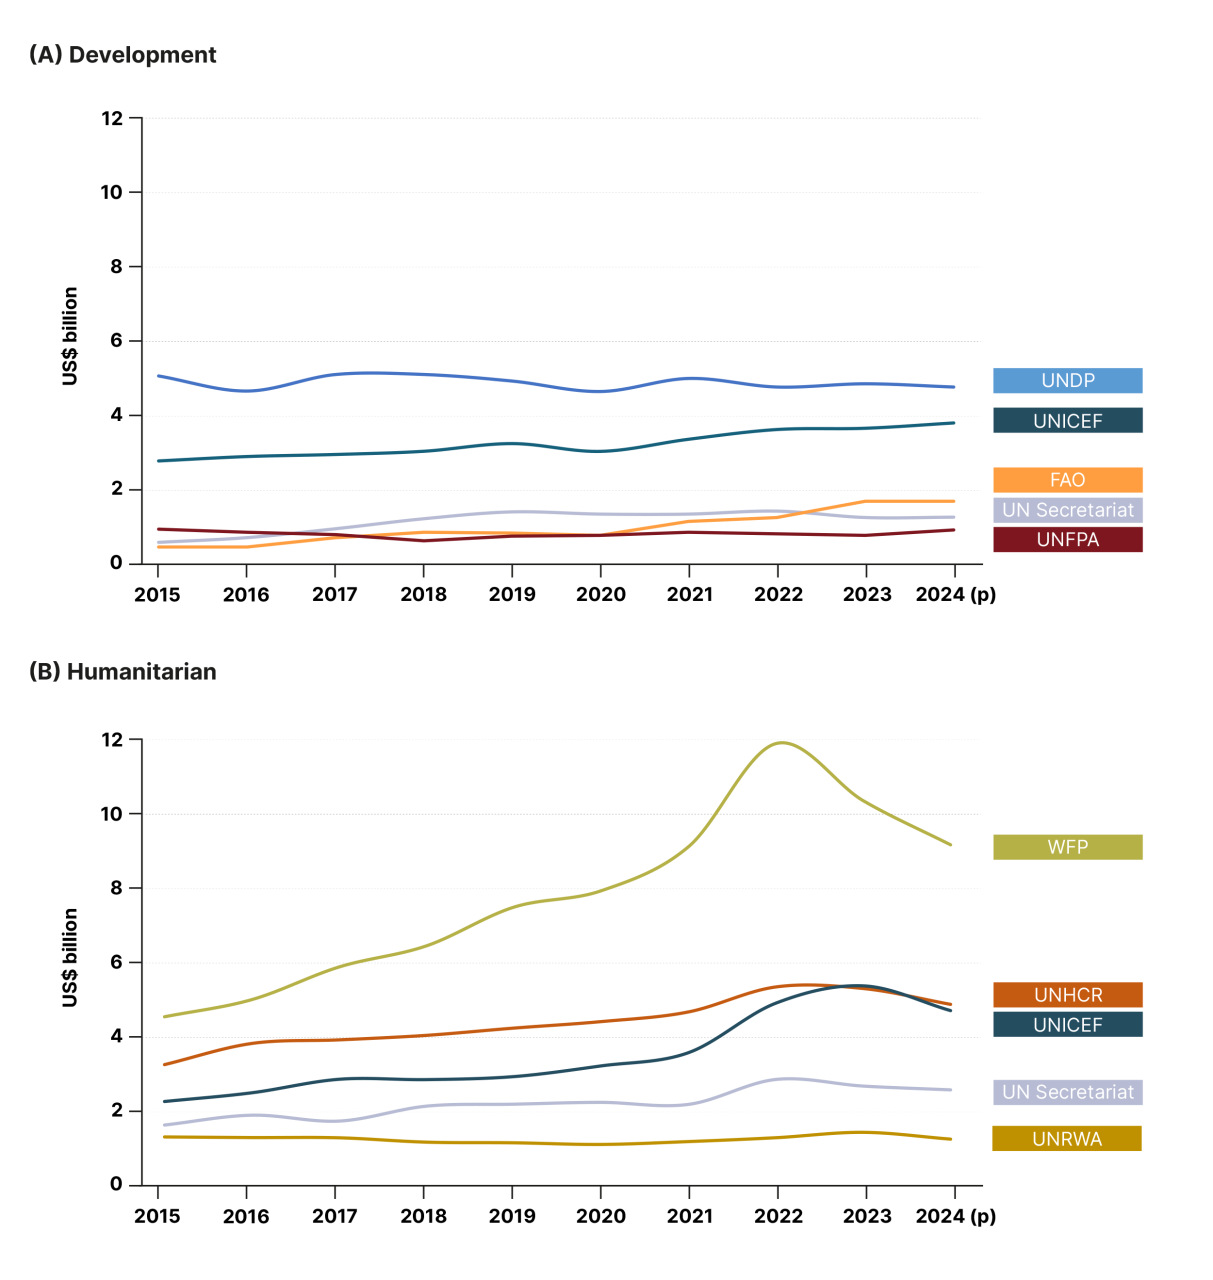
Figure 29 Total expenses for development and humanitarian assistance by select UN entities, 2015–2024 (US$ billion)
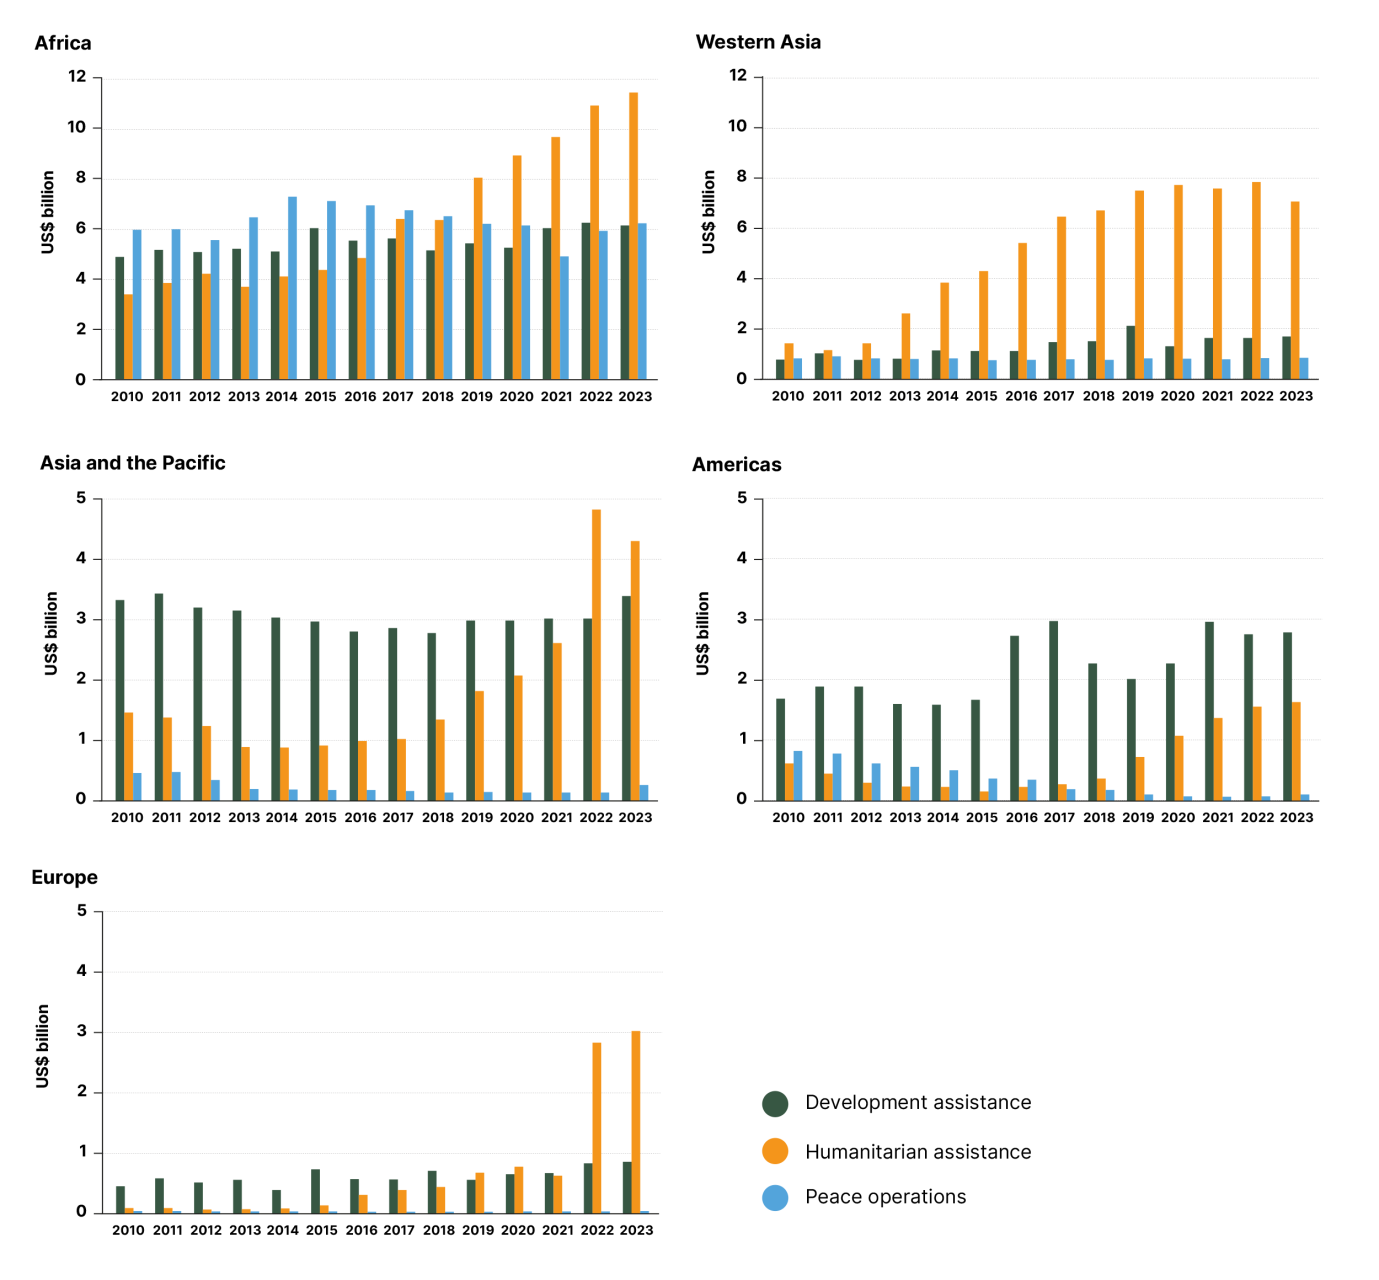
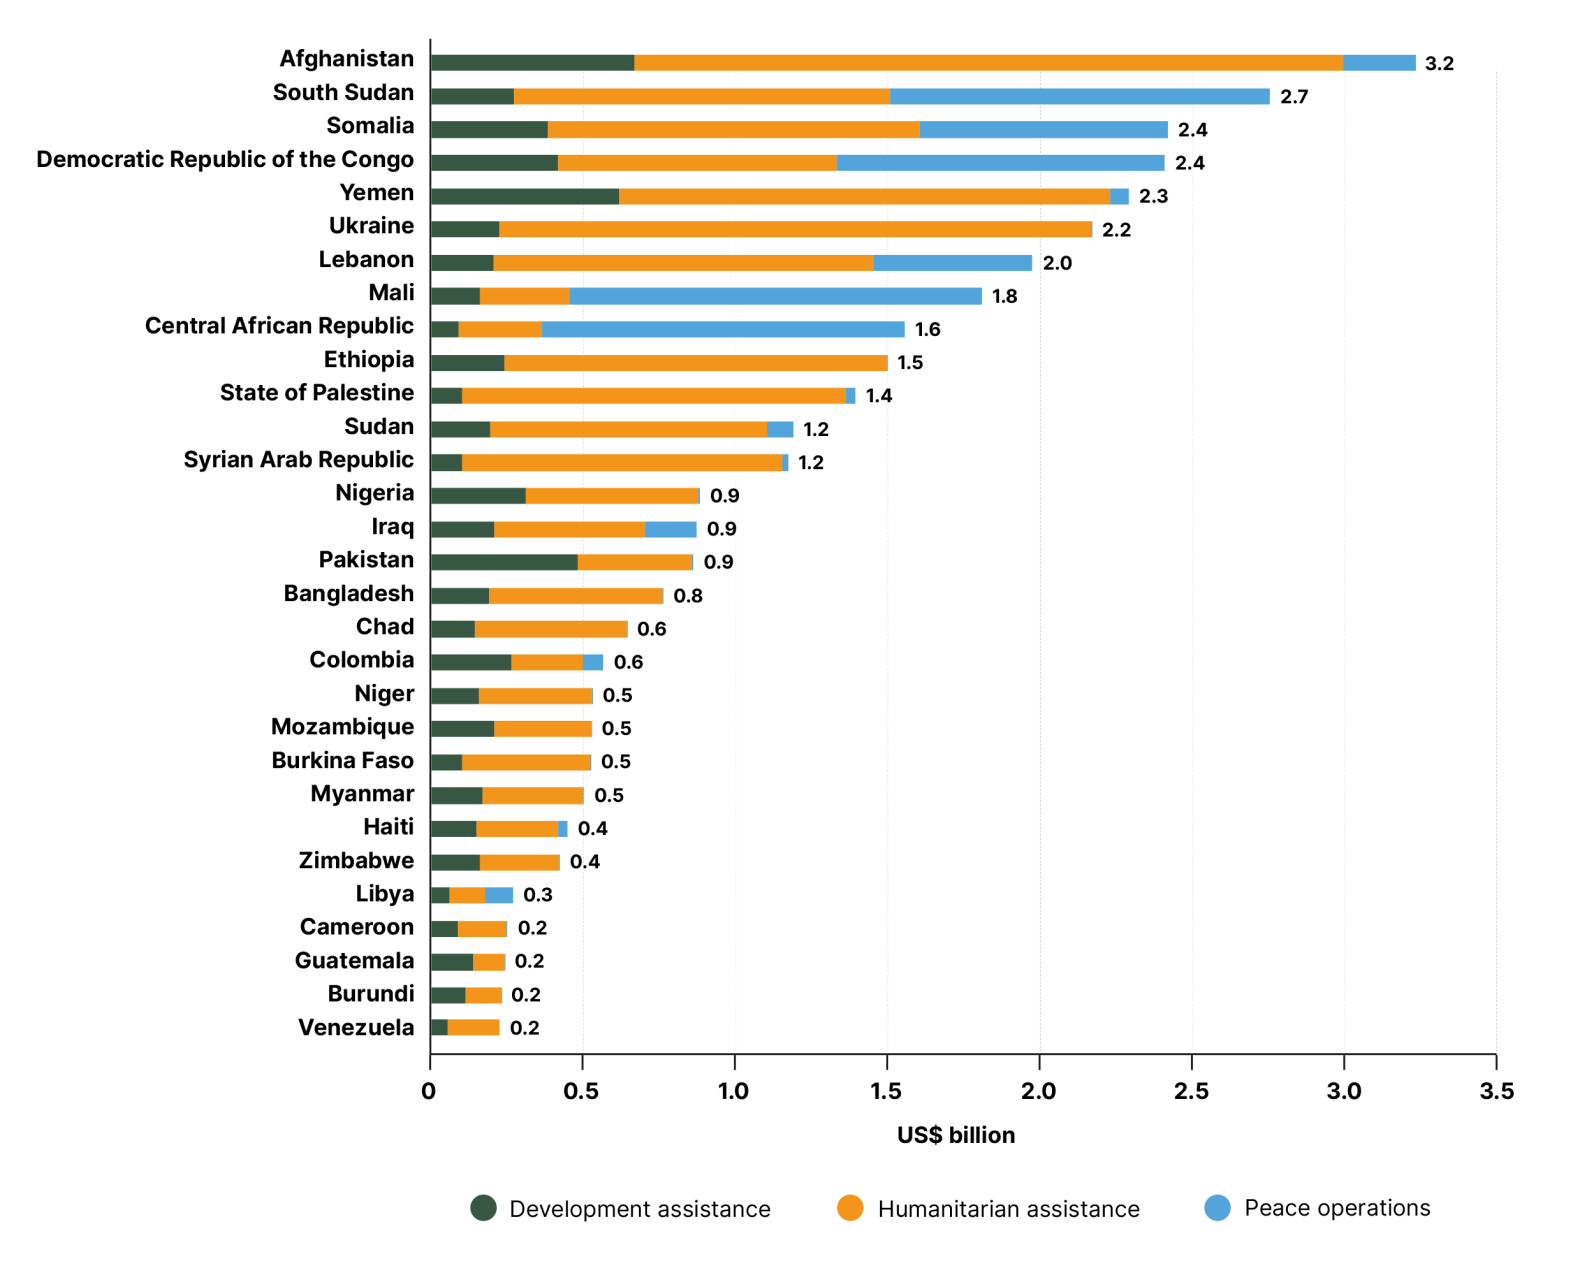
Figure 32 UN development, humanitarian, and peace operations expenses by crisis-affected country, 2023 (US$ billion)
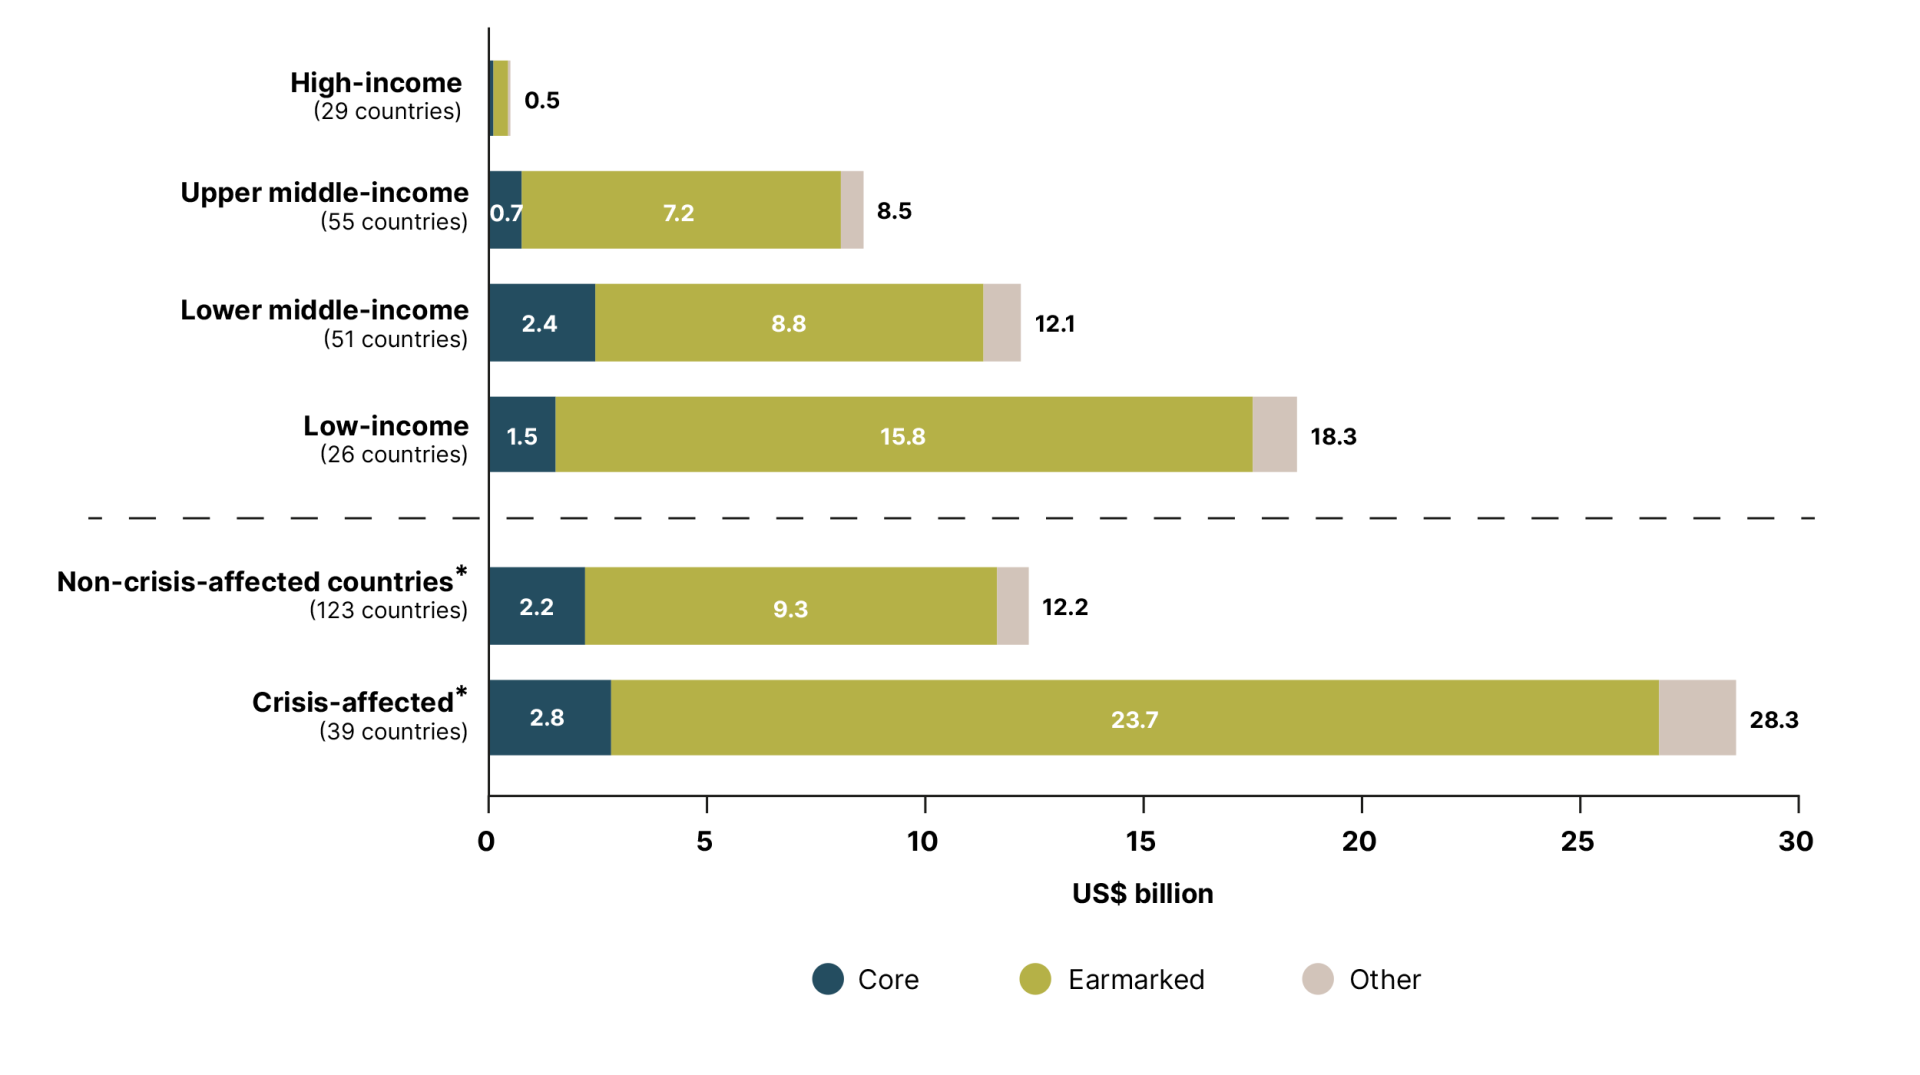
Figure 33 UN development and humanitarian expenses in UN programming countries by income status, 2023 (US$ billion)
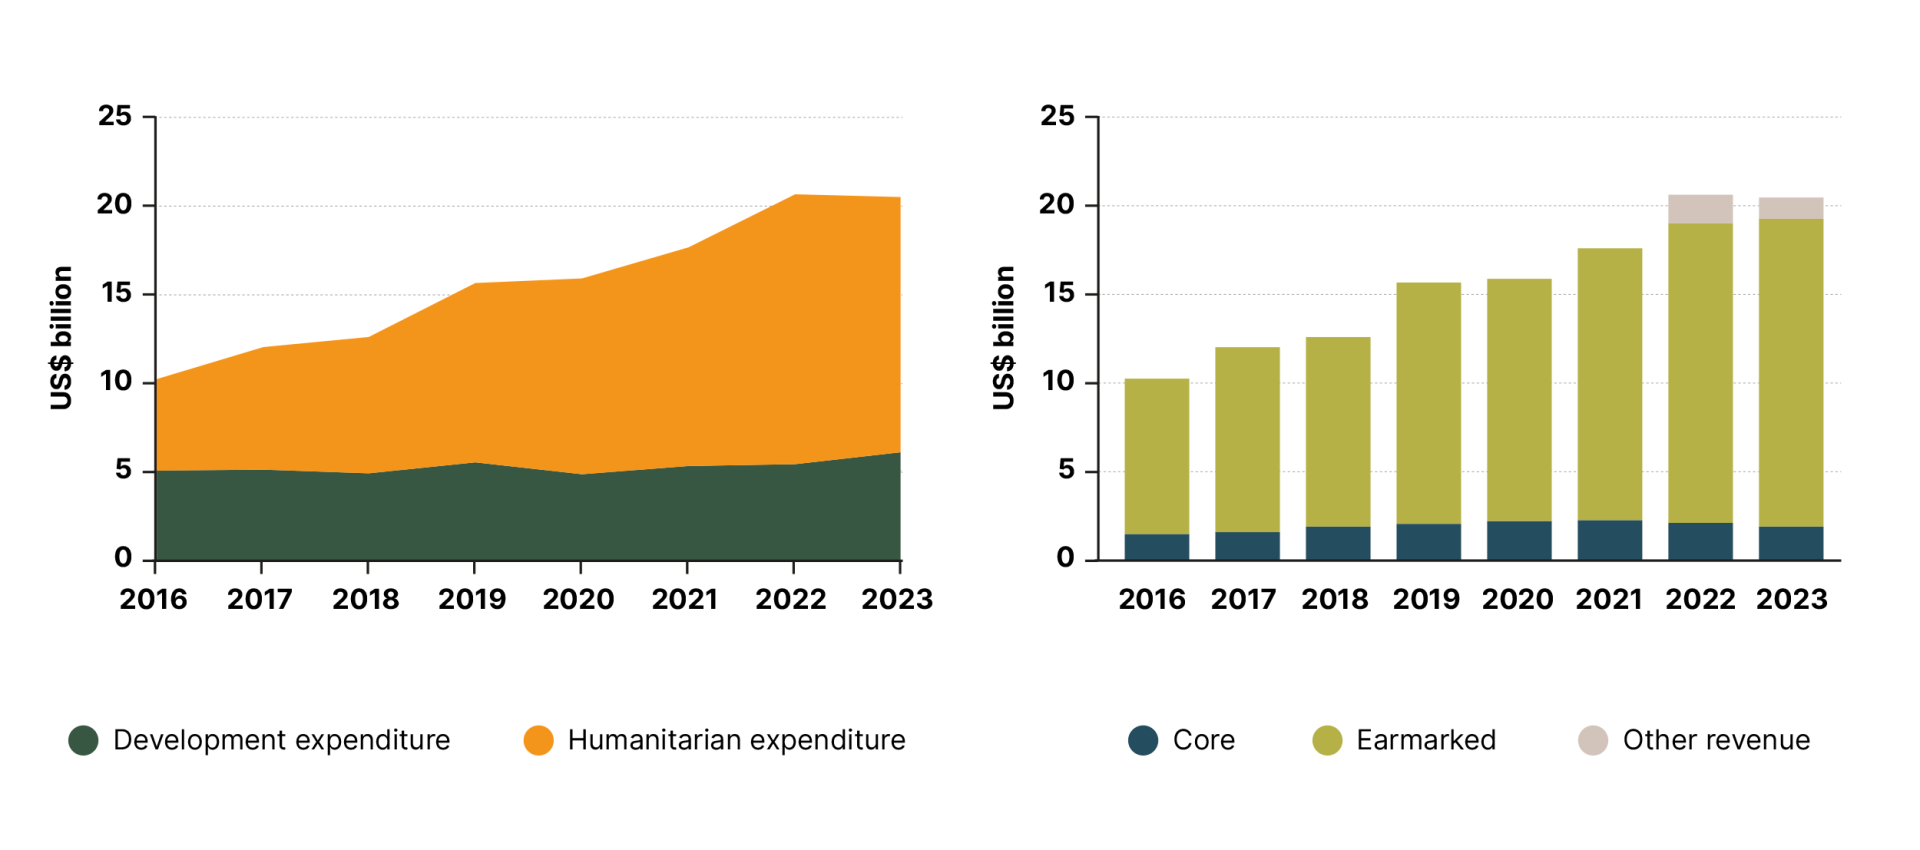
Figure 34 UN development and humanitarian expenses in least developed countries, 2016–2023 (US$ billion)