This section turns to the relationship between resource allocations and geographic distribution, focusing first on operational activities before incorporating the peace component to present a comprehensive overview of humanitarian–development–peace (HDP) expenses by region.
Figure 30 shows UN system humanitarian and development assistance expenses in UN programme countries by region for 2010, as well as from 2019 to 2023. The regions are disaggregated according to the classification used by the UN Department of Economic and Social Affairs (DESA), namely: Africa,64 Americas,65 Asia and the Pacific,66 Europe,67 Western Asia,68 and global/interregional – with total annual OAD expenses shown at the end of each bar. The figure points both to the growing scale of UN humanitarian and development assistance and the shifting regional distribution of resources over time.
Expenses on UN humanitarian and development assistance by region, 2010–2023 (US$ billion)
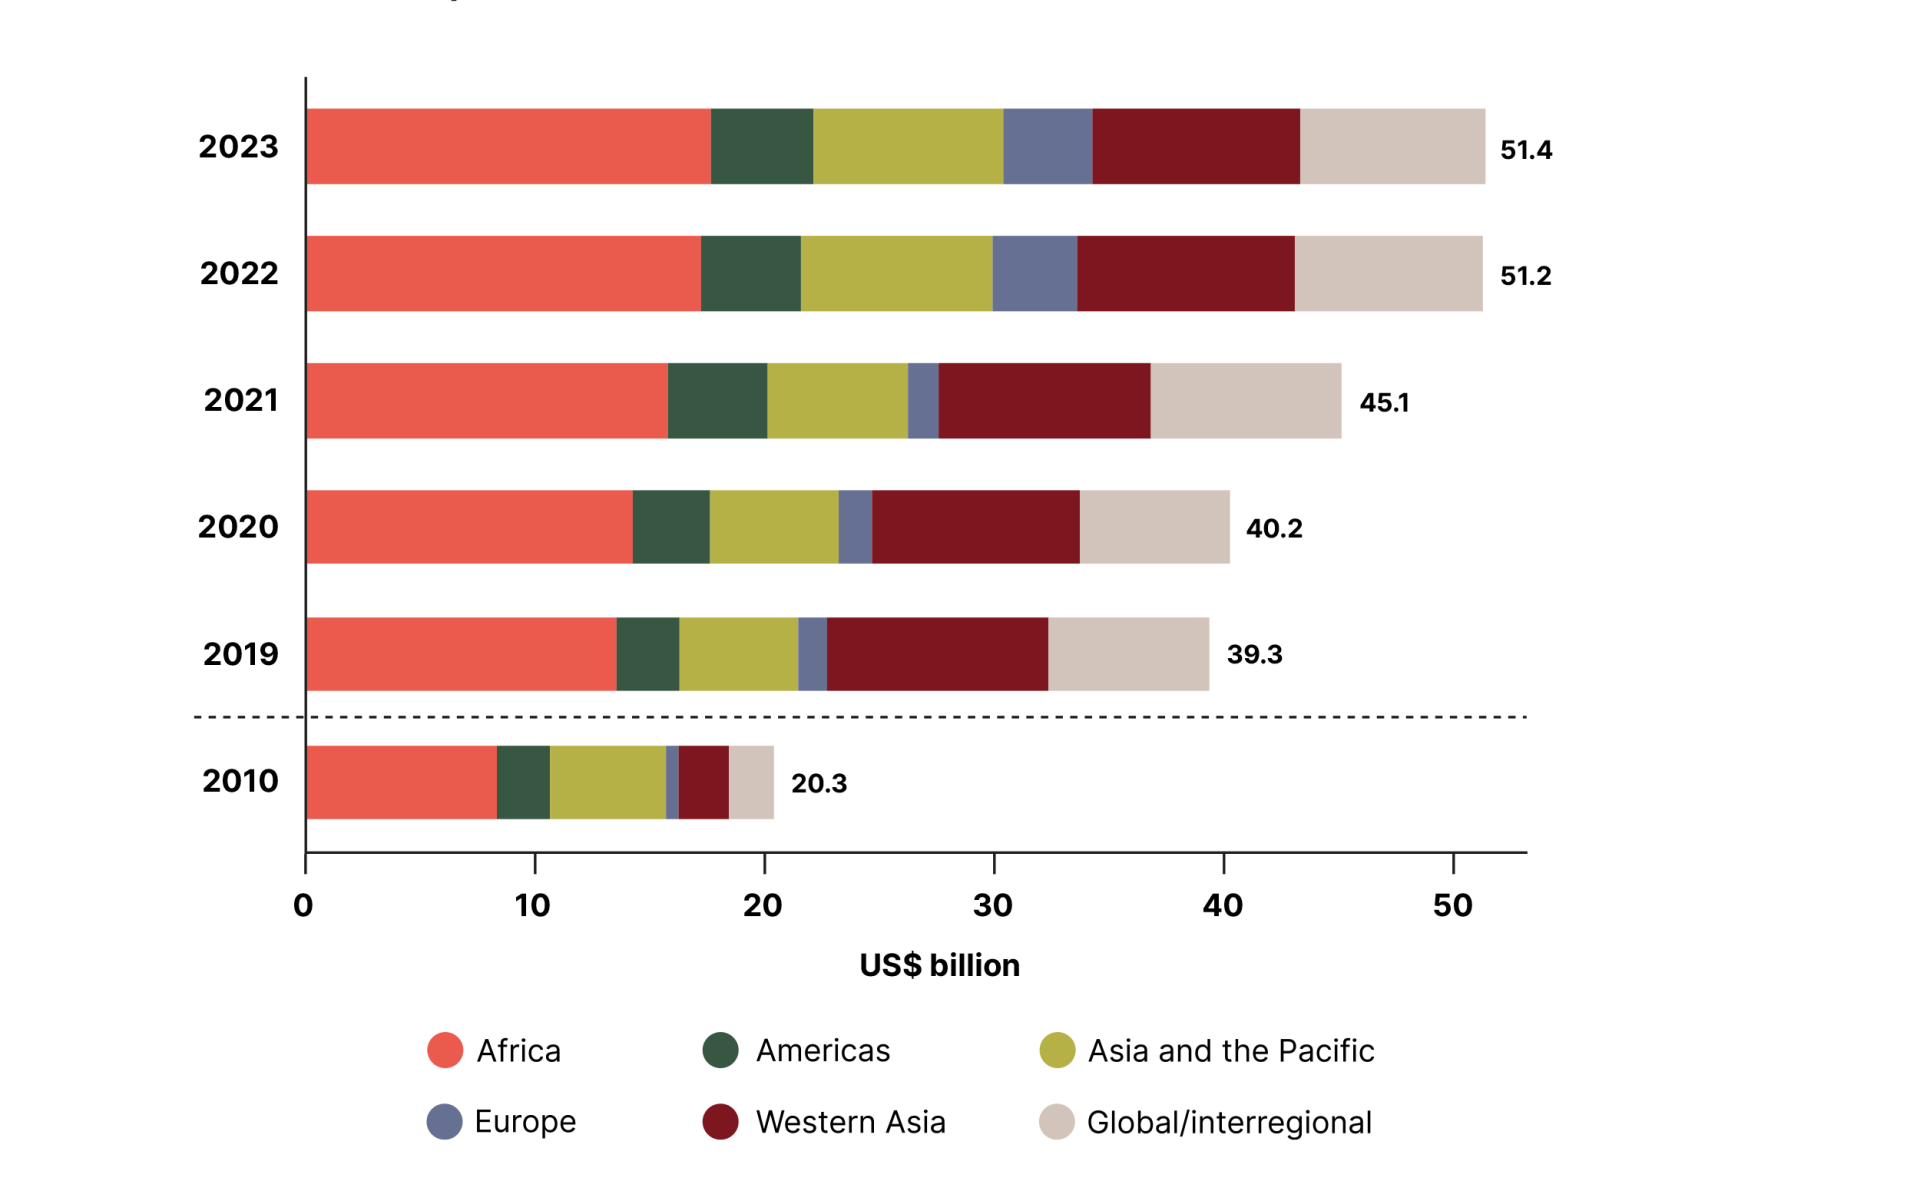
Source: Report of the Secretary-General (A/80/74-E/2025/53). Historical data from various reports.
Throughout the 2010–2023 period, Africa consistently received the largest share of UN OAD expenses, with allocations rising steadily from US$ 8.3 billion in 2010 to US$ 17.6 billion in 2023 – a compound annual growth rate of 6.0%. Western Asia saw a marked increase in funding after 2012 and has become the second-largest regional recipient in recent years, registering a compound annual growth rate of 11.4%. By contrast, the Americas and Asia and the Pacific displayed stable trends, as well as lower compound annual growth rates of 5.1% and 3.9% respectively. Europe received the smallest share of regional allocations, although it holds the period’s highest compound annual growth rate: 16.2%. As Figure 30 makes clear, expenses in Europe rose notably following the 2022 escalation of the conflict in Ukraine.
Up to this point, aggregate UN regional expenses in development and humanitarian assistance have been presented (ie UN OAD). This section disaggregates annual expenses by region and function, including those related to peace operations. This approach offers a clearer view of the evolving functional distribution of expenses within regions, facilitating comparison between them. The inclusion of peace operation expenses reflects the importance of strengthening coherence across humanitarian, devel opment and peace efforts, a crucial prerequisite to reducing vulnerabilities, supporting preven --tion and, ultimately, shifting from delivering humani tarian assistance to ending need.69
Each of Figure 31’s panels includes only UN programme countries from the respective region, with the bar charts illustrating the evolution of UN HDP expenses from 2010 to 2023. For the African region, UN expenses maintained a relatively balanced distribution across the three functions from 2010 to 2018, with peace operations consistently taking the lead in annual allocations. Beginning in 2019, however, humanitarian assistance started to rise, surpassing the other functions and eventually reaching US$ 11.5 billion in 2023. By contrast, peace operations expenses plateaued at around US$ 6 billion, while development assistance remained relatively stable, ranging between US$ 5.0 and US$ 6.2 billion. This shift reflects intensifying humanitarian needs arising from protracted conflicts in the Sahel region and countries such as Ethiopia, Sudan, South Sudan, the Democratic Republic of the Congo and Somalia, along with the region’s heightened exposure to climate shocks and food insecurity, all of which has led to significant population displacement.
In Western Asia, humanitarian expenses have enjoyed the largest share of UN allocations ever since 2010, a situation that has only intensified over the years. This is reflected by the sharp rise in humanitarian expenses from US$ 1.4 billion in 2010 to a peak of US$ 7.9 billion in 2022, against a backdrop of multiple large-scale, long-term, complex crises. Of particular note is the conflict in Syria, which has been ongoing since 2011, and the Yemen crisis, which escalated in 2015. Both have led to humanitarian emergencies characterised by widespread famine risk, health system collapses and mass displacement.70 Here, it should be pointed out that the increase in humanitarian needs resulting from the current conflict in Gaza is not fully reflected in Figure 31 due to the timeframe involved.
In Asia and the Pacific, development assistance accounted for the largest share of UN expenses up to 2021, ranging from US$ 2.8 billion to US$ 3.4 billion. However, humanitarian expenses spiked in 2022, reaching US$ 4.8 billion, after the 2021 abandonment of democratic governance and subsequent full-scale armed conflict in Myanmar, and the Taliban takeover in Afghanistan.71 Notably, peace operations in the region have consistently accounted for only small share of UN expenses over time, with minimal variation.
In the Americas, development assistance has not only accounted for the largest share of UN expenses in every one of the recorded years, but enjoyed a notable increase over the period, reaching a high of US$ 3.0 billion in both 2017 and 2021. Peace operation expenses declined sharply following the closures of the UN Stabilization Mission in Haiti (MINUSTAH) and the UN Mission for Justice Support in Haiti (MINUJUSTH). On the other hand, humanitarian assistance rose significantly after 2018 – reaching US$ 1.6 billion in 2023 – due to the widening of several regional crises. These included rapidly growing numbers of Venezuelan refugees and migrants caused by their home country’s ongoing political, economic and humanitarian difficulties,72 as well as multifaceted humanitarian challenges in El Salvador, Guatemala and Honduras driven by increased transit migration, climate-related disasters and food insecurity.
Europe has historically been the smallest recipient of UN expenses across all functions. Beginning in 2022, however, the region experienced a sharp rise in UN humanitarian assistance, peaking at US$ 3.0 billion in 2023, largely in response to the war in Ukraine. By contrast, development assistance remained low and relatively stable, while peace operations played only a marginal role in the region’s overall expenses profile.
Development, humanitarian and peace by region, 2010-2023 (US$ billion)
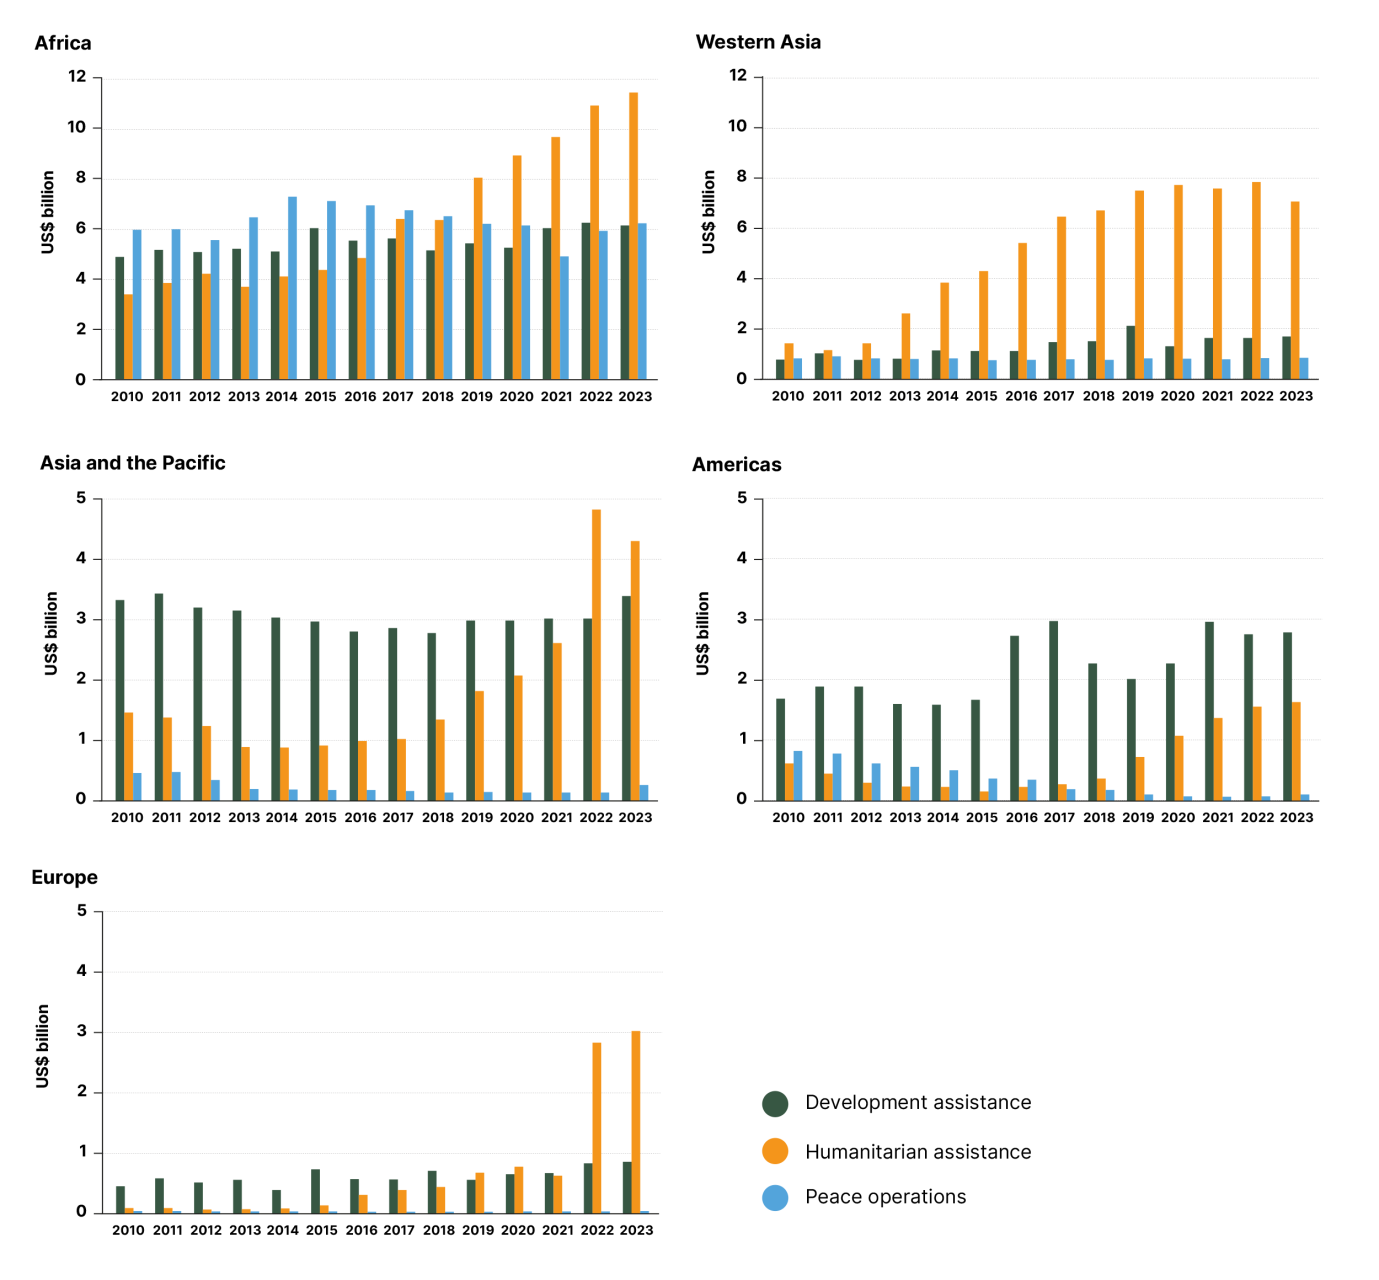
Source: Chief Executives Board for Coordination (CEB) and Report of the Secretary-General (A/80/74-E/2025/53).