The UN system’s funding outlook is tightening. Total revenue in 2024 reached US$ 68.3 billion – a 1% decrease, in real terms, from the previous year. Projections point to a contraction of 12.3% in 2025, followed by decreases of 4.3% in 2026 and 5.2% in 2027. Should these estimates prove correct, total UN revenue in nominal terms will have fallen to US$ 54.3 billion by 2027 and will be several percentage points lower than in 2015 in real terms.
Governments remain the primary source of funding for the UN system, accounting for three-quarters of UN system revenue in 2024 (including contributions from the EU). The top three Member State contributors provided around a third of overall UN revenue and the top ten nearly half. Dependence on a small number of major Member State contributors makes the UN system highly vulnerable to shifts in the domestic politics and payment discipline of these Member States.
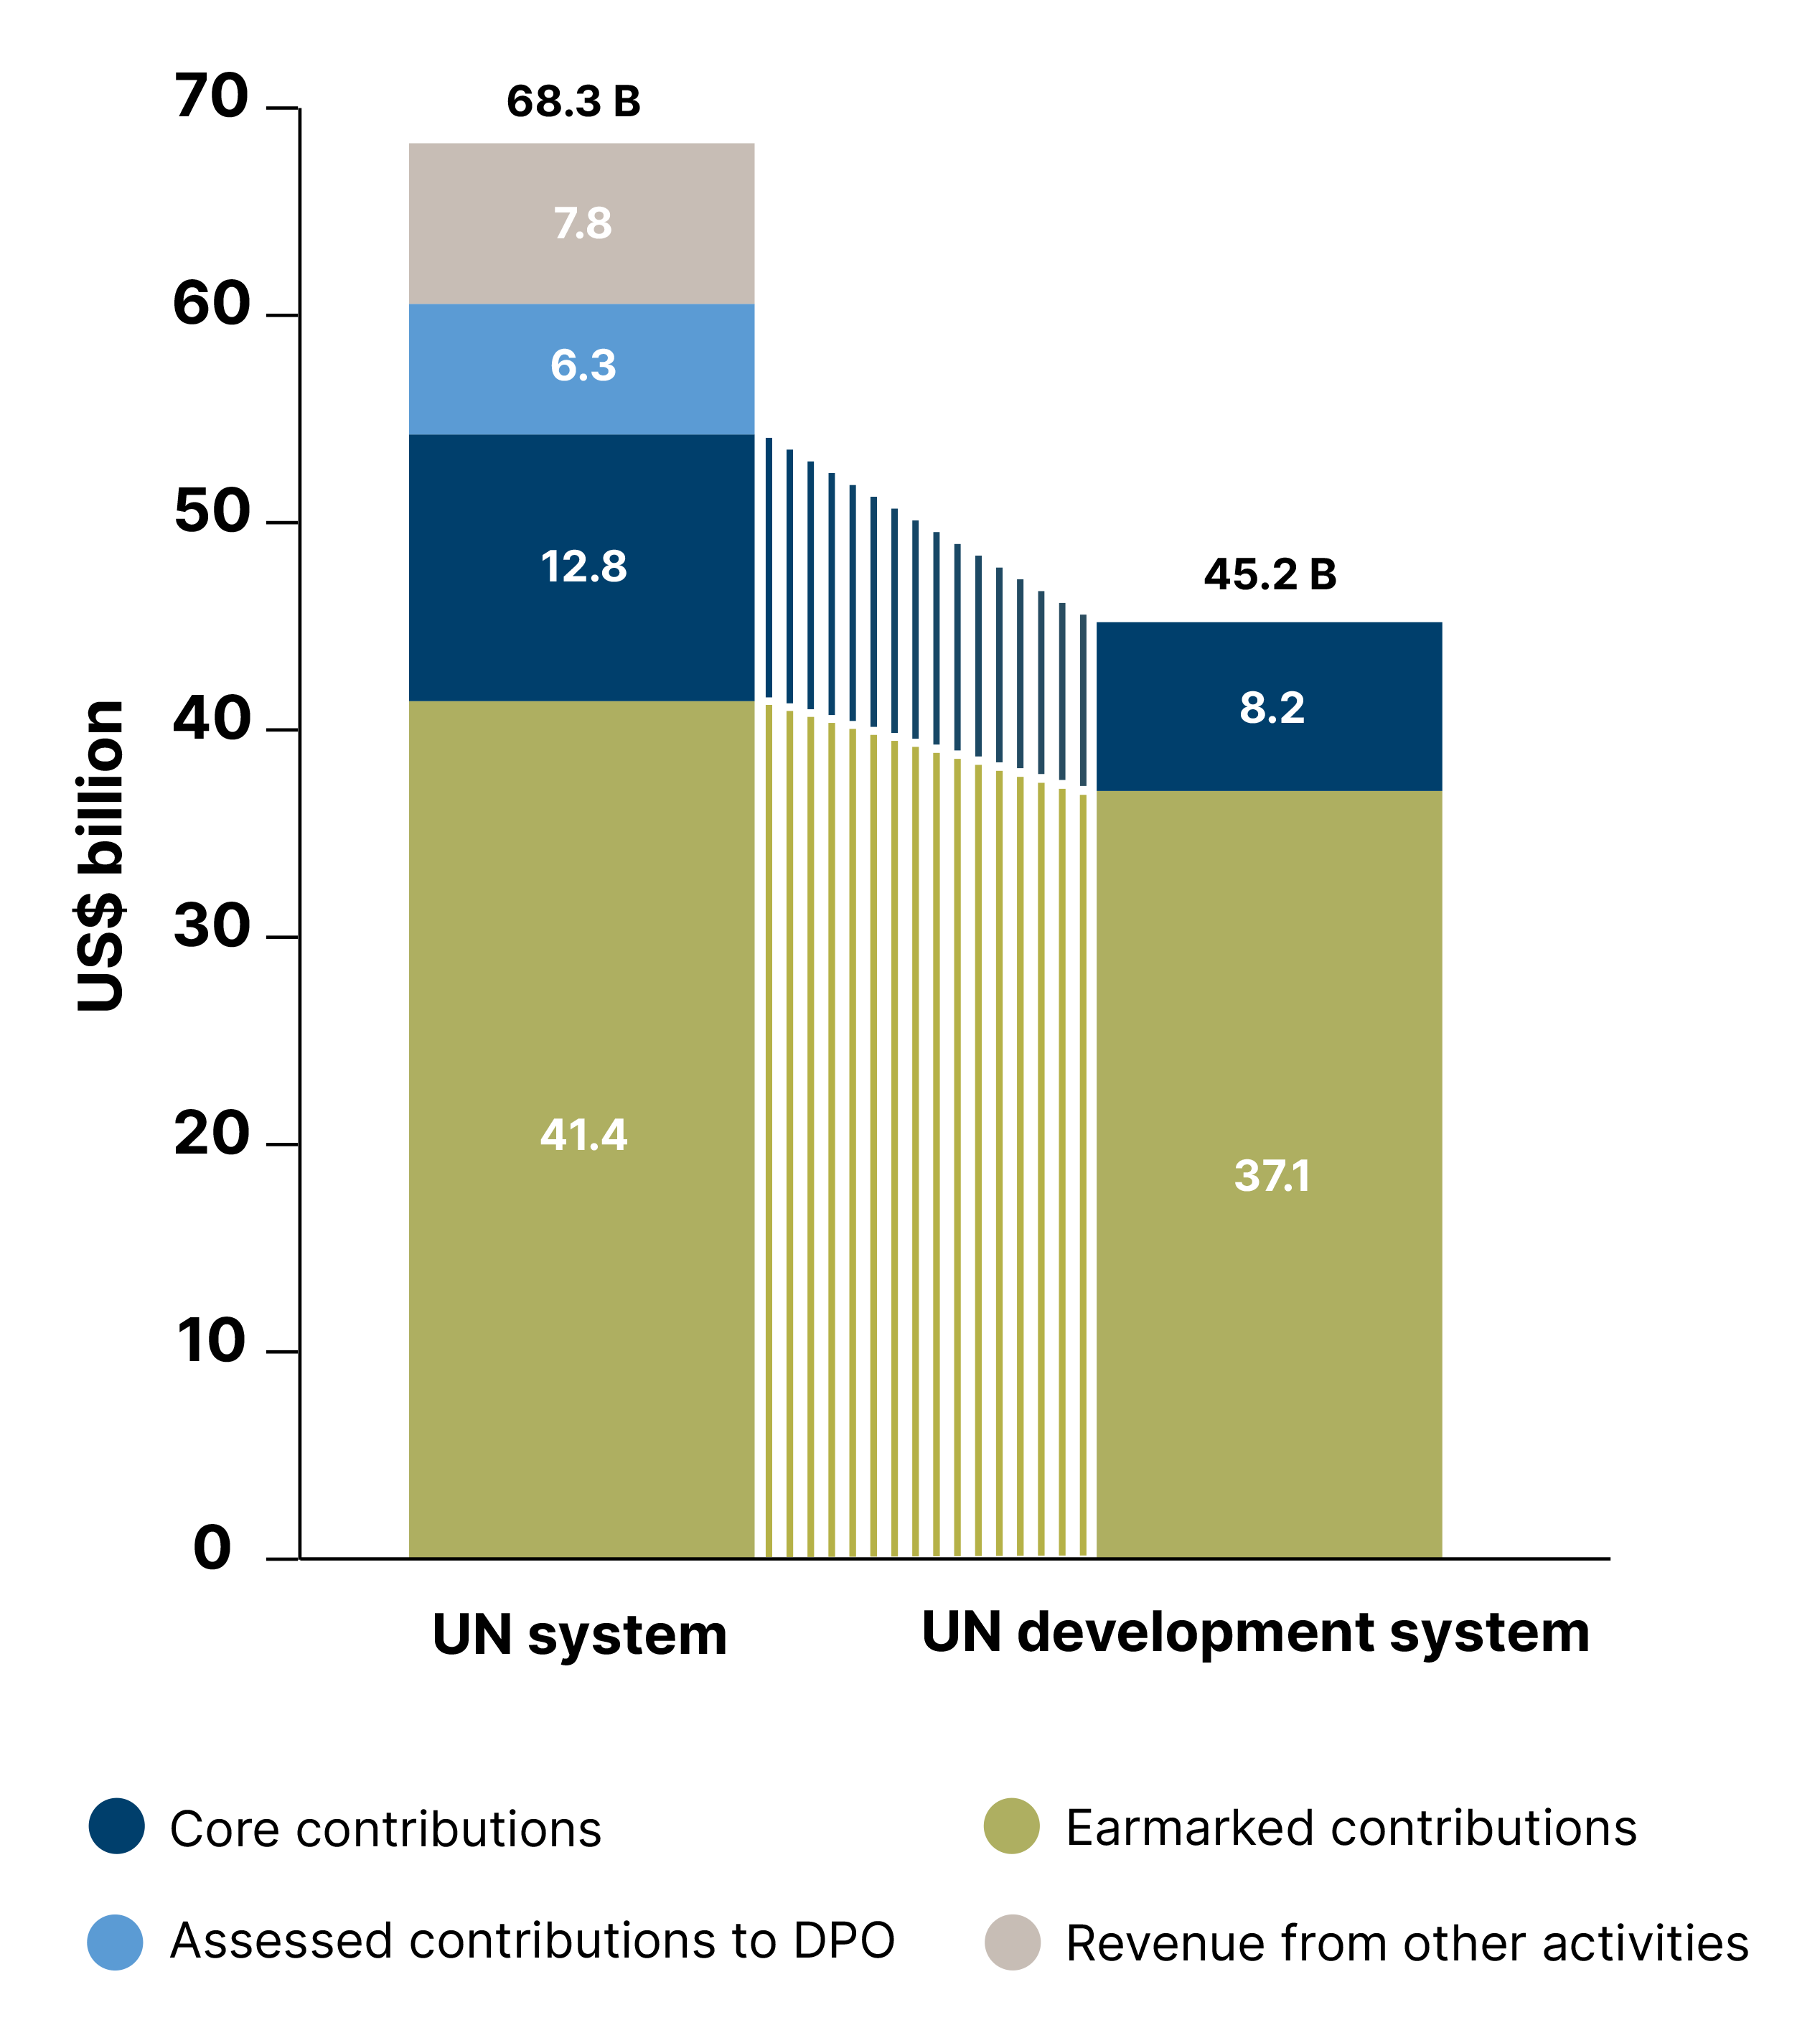
Contributions to the UN system and UN development system, 2024 (US$ billion)
Source: Chief Executives Board for Coordination (CEB) and Report of the Secretary-General (A/81/75/Add.1-E/2026/61/Add.1).
Core funding supports organisational coherence, responsiveness and strategic planning, as well as the ability to scale up results and address unforeseen challenges. Despite this, only 28% of 2024 UN system revenue consisted of core resources (assessed and voluntary), a figure that falls to 18% in the case of the UNDS. Late payment of assessed contributions and accumulating arrears from some Member States have raised concerns about significant cash shortfalls, and a resultant liquidity crisis within the UN Secretariat.
By contrast, 45% of contributions received by the UN system and 74% by the UNDS are earmarked to specific projects or programmes. Over the past decade, earmarked resources have played a significant role in expanding the UN system’s resource base. Nevertheless, multilateral effectiveness requires a shift in emphasis from highly specified project-level funding to broader pooled arrangements that can enhance scale, flexibility, risk tolerance and inter-agency collaboration.
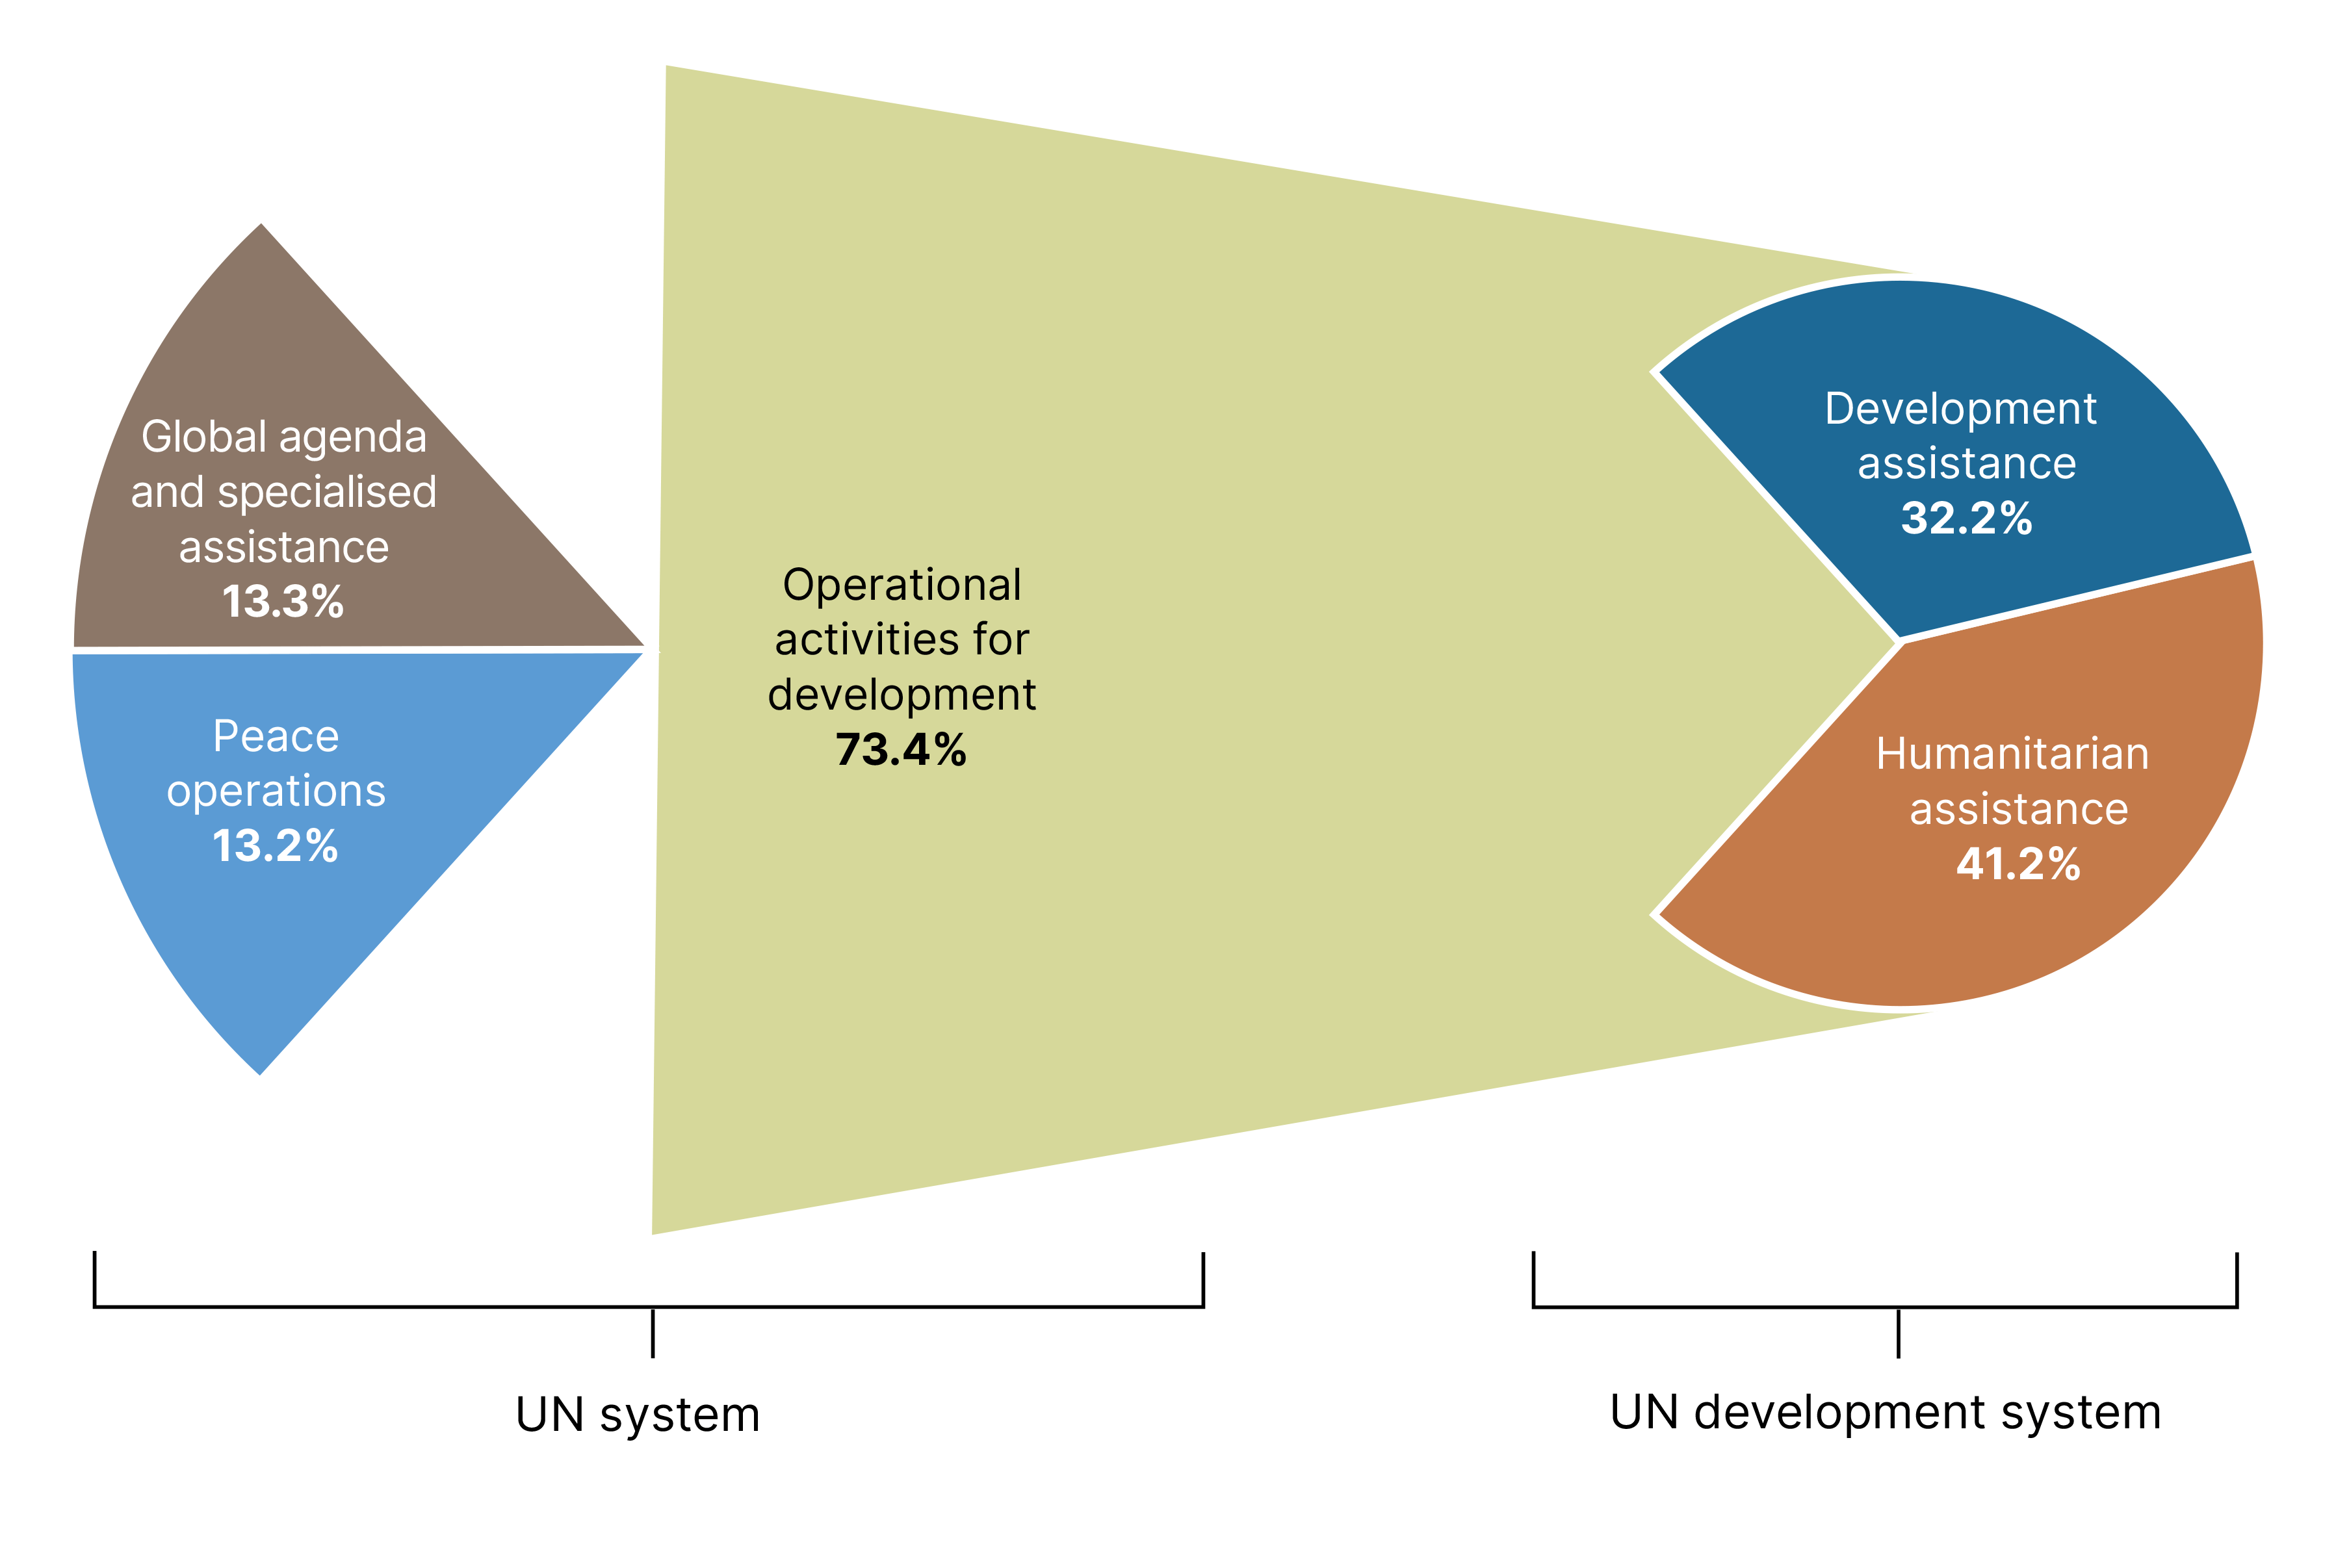
Total UN system expenses amounted to US$ 66.0 billion in 2024, a decrease of 3.6% compared with the previous year, and are projected to drop by a further 14.2% to US$ 56.6 billion in 2027 (see Chapter 3). Humanitarian assistance accounted for 41% of this figure, having fallen by US$ 3.5 billion – consistent with broader declines in funding for humanitarian needs. Unfortunately, this is reflective of many donors scaling back their humanitarian budgets rather than any reduction in such needs globally. Funding volumes directed at coordinated humanitarian plans continue to fall short of identified requirements.
The gap between humanitarian needs and available resources continues to widen. Although total humanitarian requirements declined in 2024 due to methodological changes and a stronger emphasis on prioritisation, these adjustments were intended to focus limited resources on the most vulnerable populations rather than signal any reduction in needs. As resources become increasingly constrained, humanitarian actors are being forced to make difficult choices, concentrating assistance on those with the most acute needs while leaving other vulnerable populations without adequate support.
UN system expenses by function, 2024
Source: Chief Executives Board for Coordination (CEB) and Report of the Secretary-General (A/81/75/Add.1-E/2026/61/Add.1).
Despite continued financial constraints, the UN remains present and committed, delivering assistance where needs are greatest, particularly in crisis-affected countries. In 2024, the world’s 39 crisis-affected countries accounted for almost half the UN system’s expenses. Amid the ongoing reallocation of shrinking funding across crises, assistance to LDCs experienced a marked contraction compared to 2023. Further reductions are anticipated for the period 2025–2027.
Preliminary estimates of ODA from DAC members point to a similar trend. Net ODA declined by 8.5% in 2024, with around 86% of this reduction attributable to lower funding to and through multilateral organisations. OECD projections point to a much steeper contraction in 2025: if confirmed, the 23.3% drop in ODA will represent the largest annual decline on record. Moreover, core contributions to the UNDS are expected to shrink at an even faster rate, a 27% reduction taking them to approximately US$ 6 billion. The OECD projects that ODA will suffer a further decline of 5.8% in 2026, excluding additional pressures linked to the present (at the time of writing) crisis in the Middle East. If realised, this would represent three consecutive years of falling ODA volumes, effectively reversing much of the growth observed over the past decade.
Against this backdrop of tightening resources and rising needs, the UN80 Initiative aims to strengthen the UN system’s effectiveness and coherence, allowing it to deliver greater value for money for people and planet in the years ahead.
Box 2: Challenges in the accounting basis for reporting UN system-wide financial data
- The United Nations system refers to the network of UN entities that constitute the broader UN architecture, encompassing the UN’s principal organs; the UN funds and programmes; specialised agencies; and related organisations that work towards achievement of the UN Charter. Each entity has its own mandate, governance structure, budget and funding sources. Information on UN system revenues and expenses represents the aggregation of all data on financial inflows and outflows reported to the UN CEB by these UN entities.
- The UN development system (UNDS) is constituted by those UN entities that carry out development and humanitarian activities, collectively referred to as operational activities for development (OAD). Such activities are designed to support countries implement the 2030 Agenda for Sustainable Develop ment, with contributions to the UNDS consisting exclusively of funding for OAD.
Figure 39 compares the volume and composition of contributions to the UN system and the UNDS in 2024. Total contributions to the UN system amounted to US$ 68.3 billion, while the UNDS received US$ 45.2 billion. As can be seen, there is a significant imbalance between core funding and earmarked funding – the latter represents by far the largest share of funding in both cases. Notably, core contributions to peace operations are included in the UN system but not the UNDS, with a substantial portion of the UN’s assessed contributions dedicated to UN-DPO.
The UN system operates across four UN functions: 1) development assistance; 2) humanitarian assistance; 3) peace operations; and 4) global agenda and specialised assistance. The UNDS supports the first two of these functions. Figure 40 presents the distribution of expenses across the UN system by function in 2024. Humanitarian and development assistance accounted for 73.4% of total expenses (41.2% and 32.2% respectively); 13.2% was directed to peace operations; and 13.3% to global agenda and specialised assistance.
The data used in the tables and figures in Part One is primarily drawn from the following four sources:
- The UN CEB, which collects and publishes data from all UN systems entities according to the UN Data Standards (in some instances with further disaggregation). Data are published on the unsceb. org website: https://unsceb.org/financial-statistics.
- The UN DESA, which draws on the CEB dataset but includes only a sub-set of data focused on the UNDS. The data are presented in an annex to the Secretary-General’s annual report on implementation of the QCPR and are reported annually during the ECOSOC Operational Activities for Development Segment (OAS). In 2026, UN DESA developed an Interactive dashboard that enables users to explore UNDS’s 2024 funding flows and expense patterns. Documentation on the 2026 OAS is publicly available at: https://ecosoc.un.org/en/what-we-do/oas-qcpr/quick-links/2026-operational-activities-development-segment. The dashboard is available as part of the back ground materials accessible through the webpage.
- The UN Pooled Funds Database, which consolidates disaggregated data provided by the relevant UN administrative agents on contributions, transfers and expenses arising from UN inter-agency pooled funds.
- The OECD, which provides data on the sources and uses of ODA. The OECD Data Explorer (https://data-explorer.oecd.org/) is the OECD’s central data platform and statistical warehouse, providing access to the organisation’s collection of official datasets. Data from the ‘development’ topic was used for the purposes of this publication. See also the preliminary OECD statistical tables for 2025 and methodological notes describing ‘a historic decline in foreign aid’: www.oecd.org/en/data/insights/data-explainers/2026/04/a-historic-decline-in-foreign-aid-preliminary-2025-oda-data.html