The UN system is the global multilateral platform for collective action on peace and security, human rights, and sustainable development and humanitarian assistance. It consists of a network of organisations, including funds and programmes, specialised agencies and other bodies, each with its own mandate, governance structure, budget and funding sources. The system is mainly funded by grants, which take the form of non-repayable revenue provided by governments and other contributors.
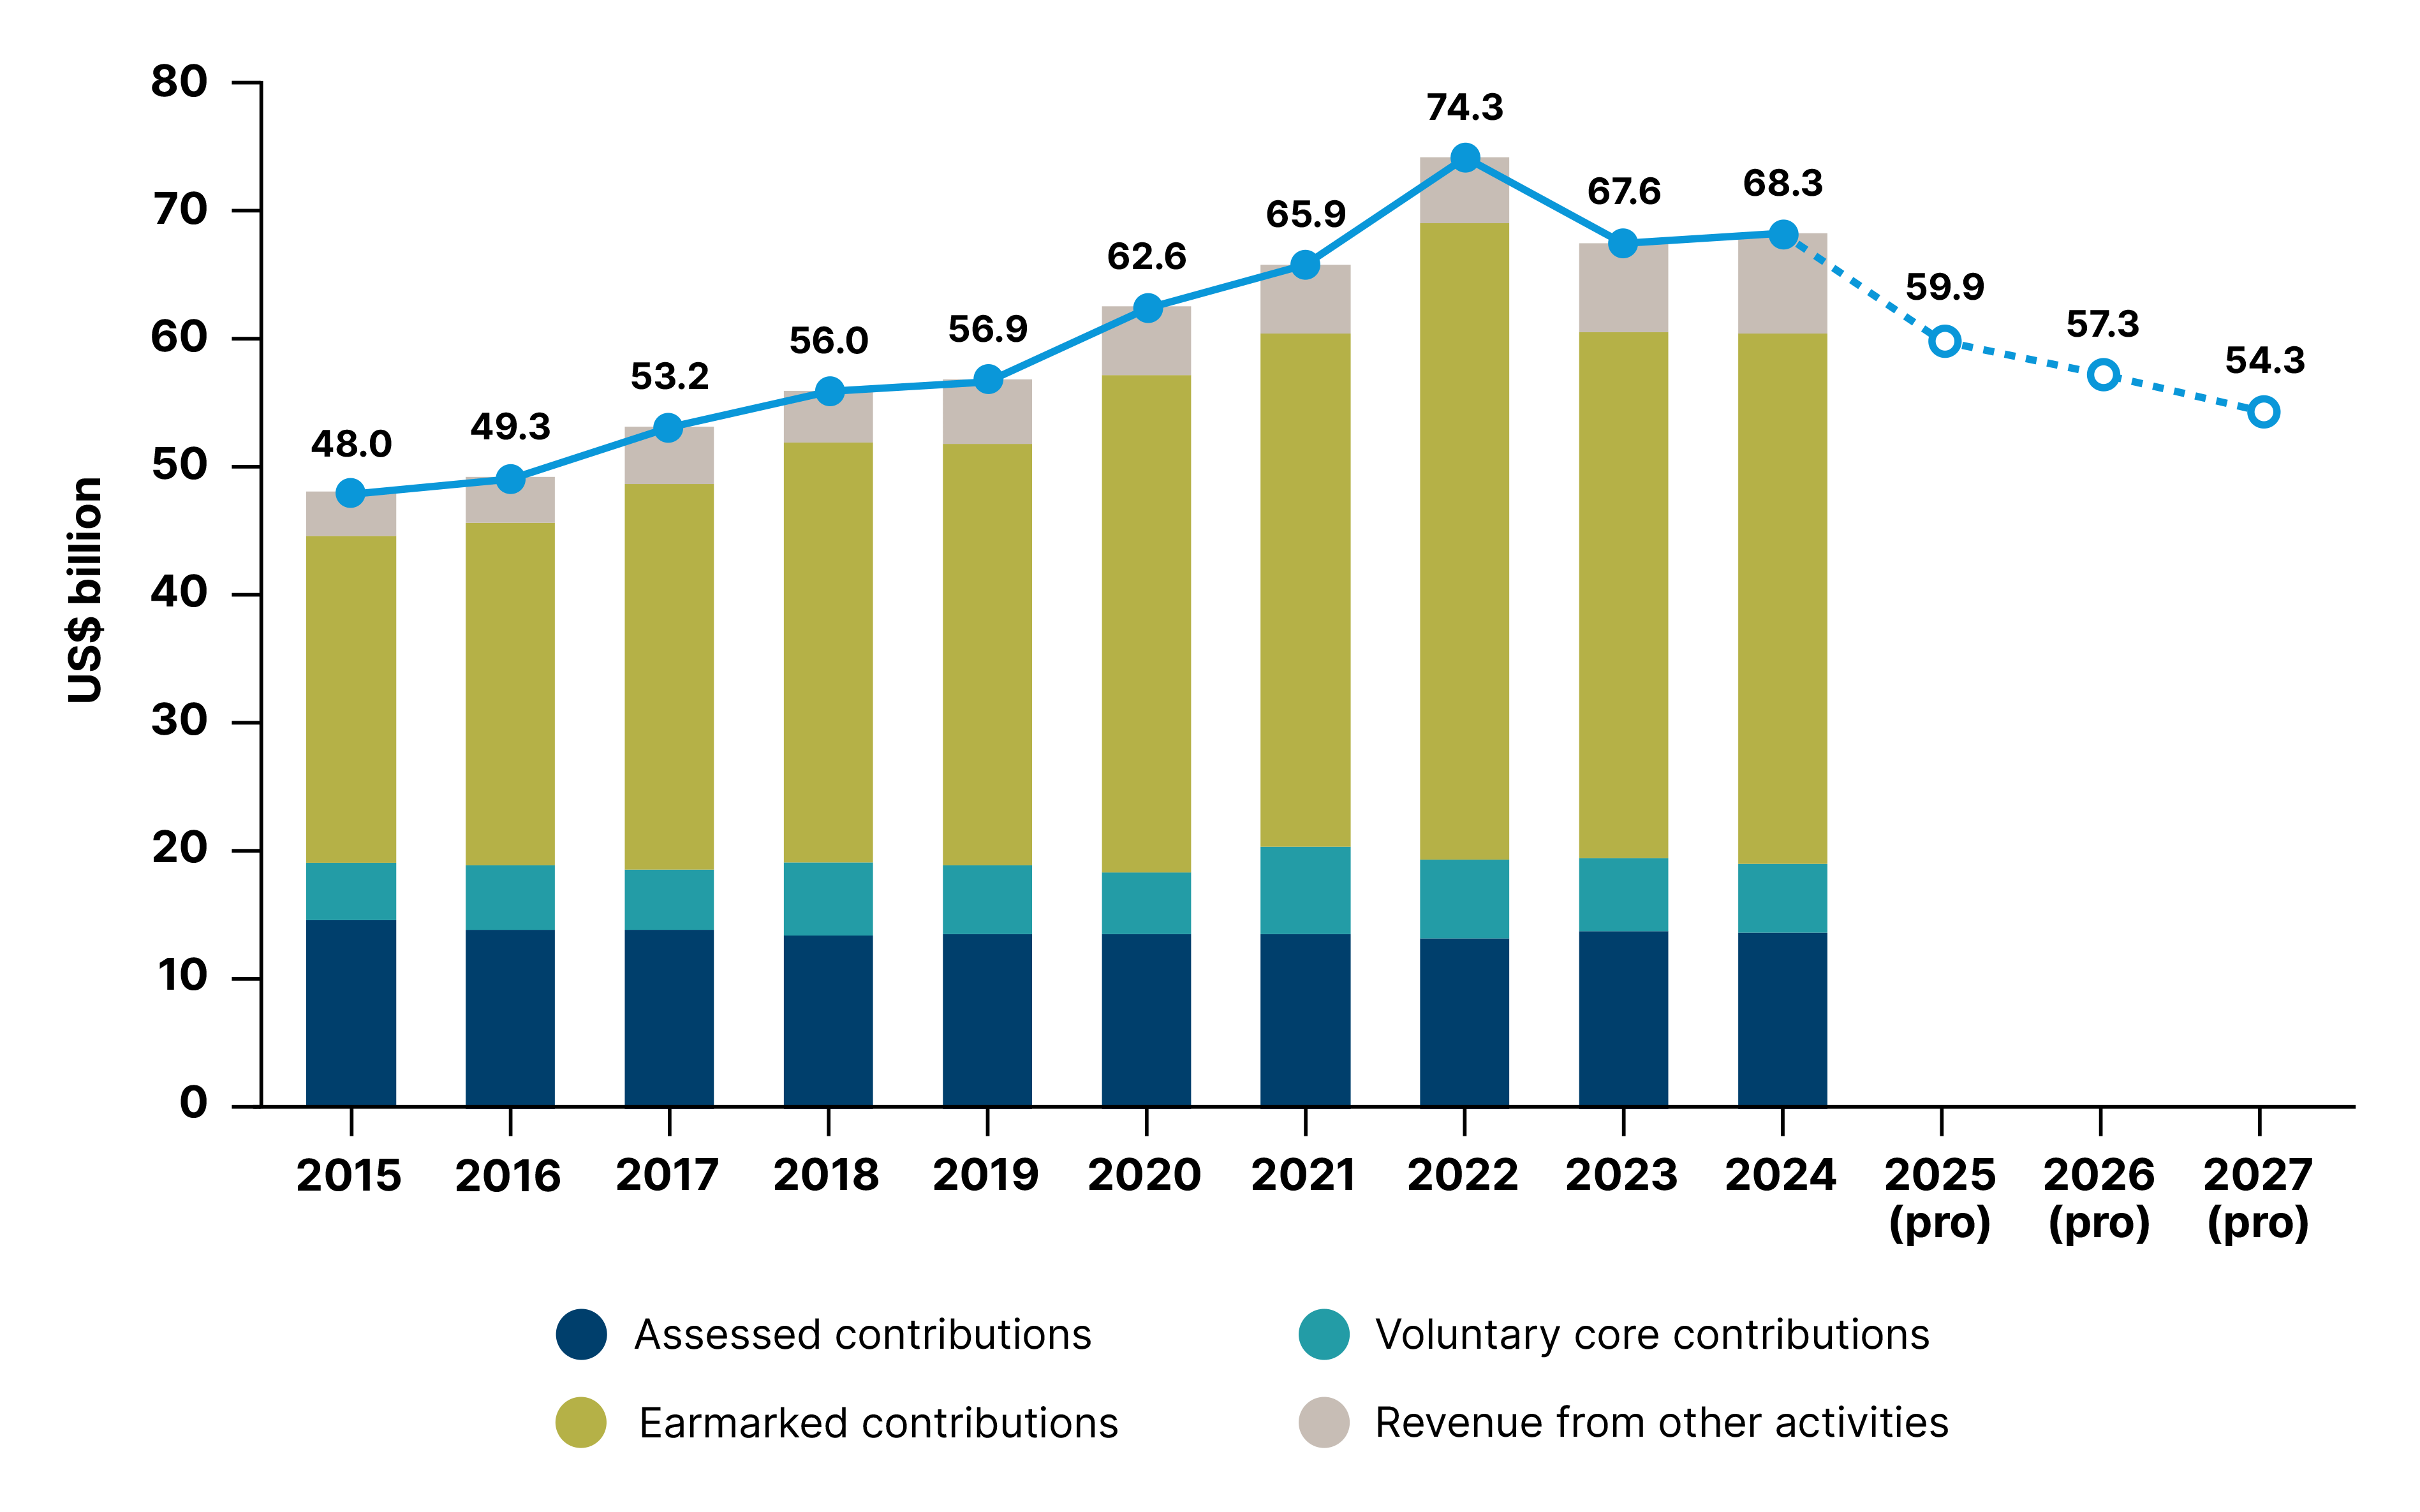
In 2024, total UN system revenue amounted to US$ 68.3 billion, a 1% nominal increase over the previous year.7 This revenue includes resources for all three pillars of the UN’s work and covers the four main functions: 1) development assistance; 2) humanitarian assistance; 3) peace operations; and 4) global agenda and specialised assistance.
Figure 1 illustrates the evolution of UN system revenue since the adoption of the 2030 Agenda. Total revenue increased steadily from US$ 48.0 billion in 2015 to a peak of US$ 74.3 billion in 2022, before declining to US$ 67.6 billion in 2023. System-wide funding underwent a modest recovery in 2024, reaching US$ 68.3 billion.
Funding of the UN system, 2015–2024 (official data) and 2025–2027 (projected) (US$ billion)
Source: Chief Executives Board for Coordination (CEB).
The decline in funding projected in each of the three years following 2024 highlights the challenging revenue outlook facing the organisation. The CEB projects a 12.3% contraction in UN system revenues for 2025, followed by an additional 4.3% decline in 2026 and a further contraction of 5.2% in 2027. This corresponds to a projected cumulative decline of 21% in UN system revenue for the period 2024–2027, bringing nominal revenue levels back to where they stood a decade earlier, in 2017.8 Compared to the historical revenue peak of US$ 74.3 billion in 2022, the projections anticipate a decline of US$ 20.0 billion, or 27%, in 2027. This reflects a large, possibly structural, downwards shift in the UN system’s overall funding level.
Figure 1 also presents the annual revenue composition as constituted by the four main financing instruments: 1) assessed contributions; 2) voluntary core contributions; 3) earmarked contributions; and 4) revenue from other activities. Assessed contributions are mandatory dues that all Member States are required to pay as part of their UN membership.9 Voluntary core and earmarked contributions are, by contrast, provided at the discretion of contributors. Whereas core contributions are provided without restrictions to support the overall budgets of UN entities, ear-marked contributions are tied to specific initiatives or projects, and often reflect contributor preferences regarding geographic focus, thematic areas or expected outcomes. Revenue from other activities includes income generated through service provision charges, as well as gains from investments and exchange rate fluctuations. Definitions of these instruments are provided in Box 1 on page 42.
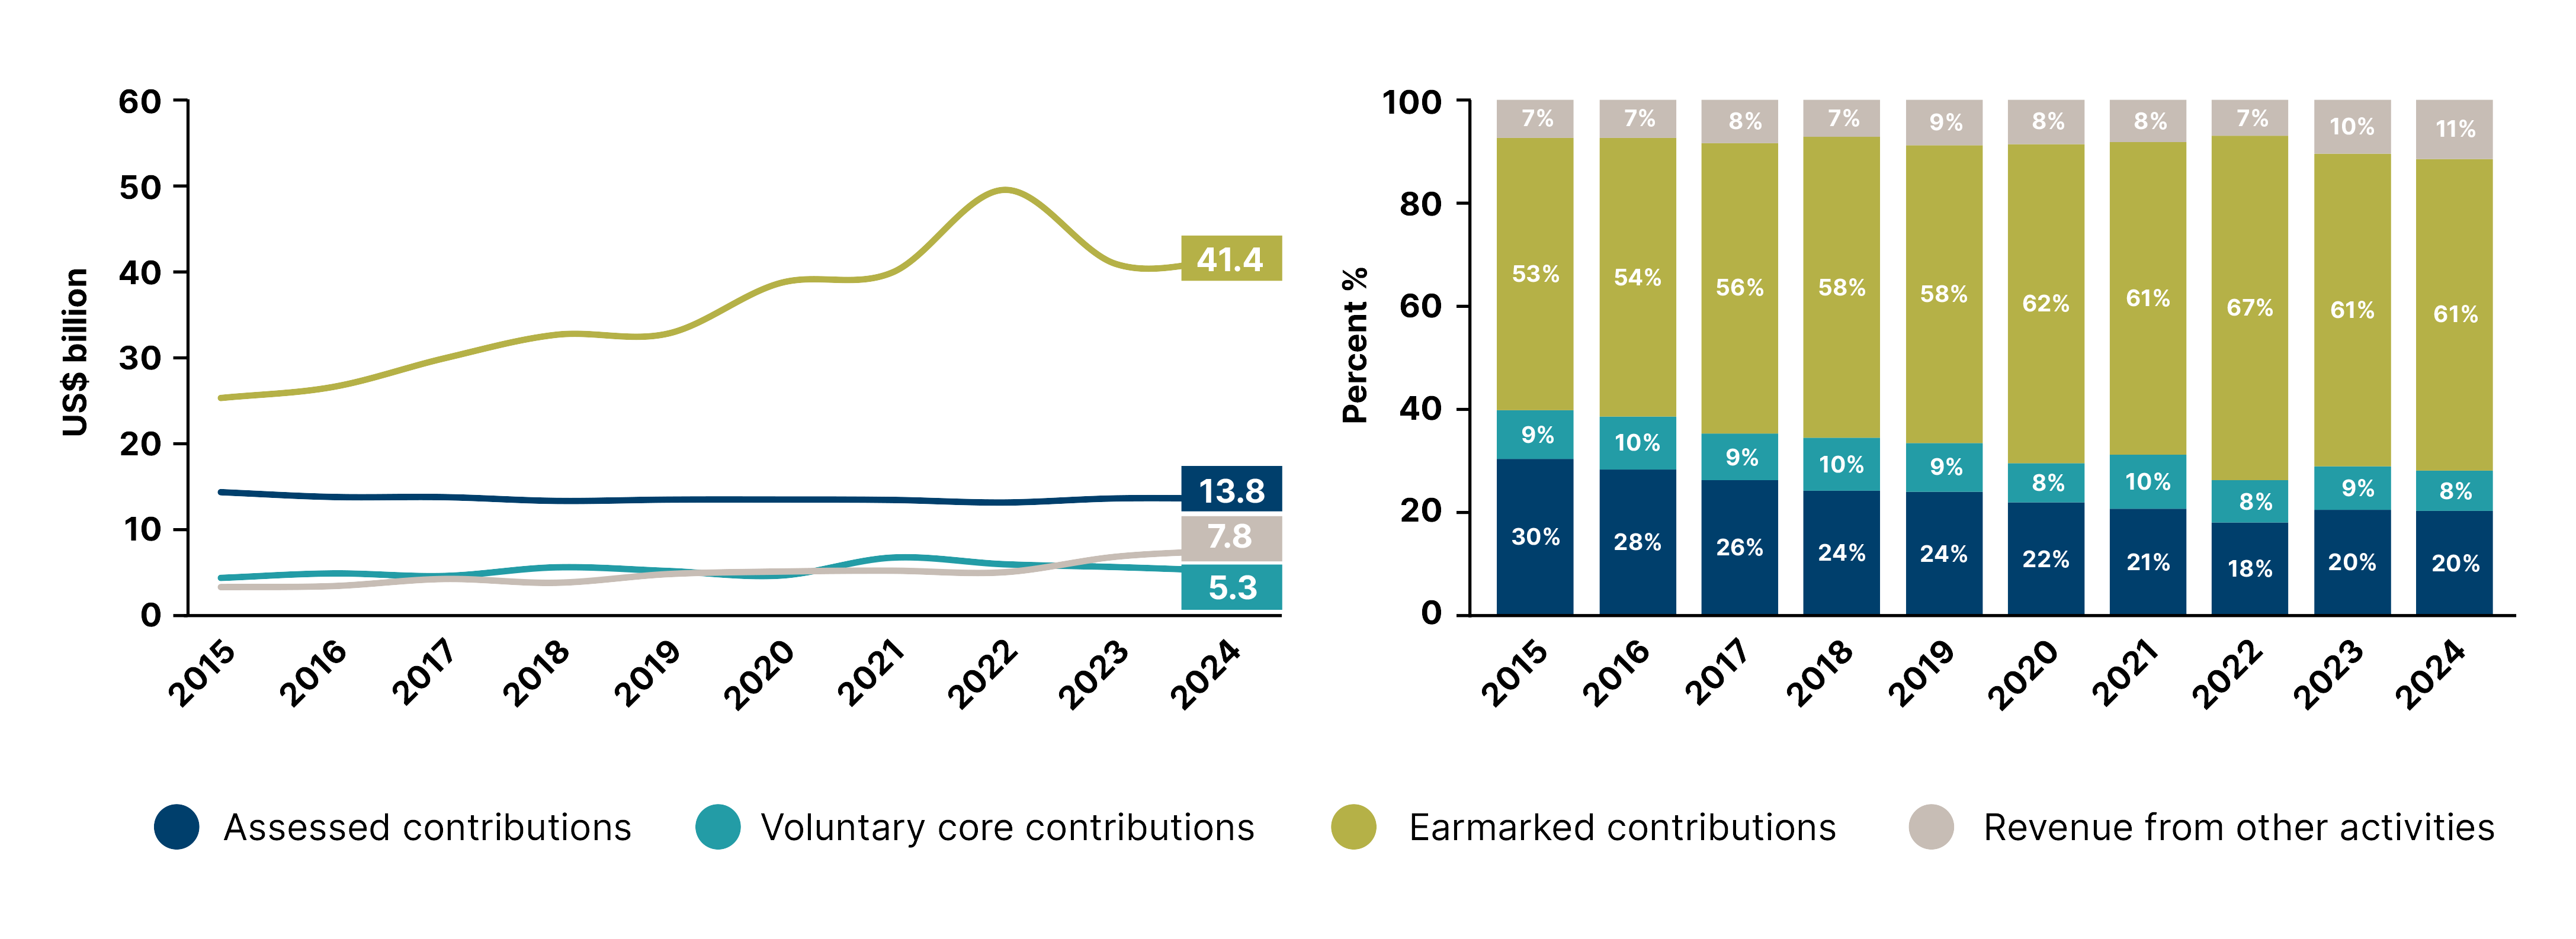
Figure 2 shows the evolution, in terms of volume, of each of these financing instruments. The left-hand panel presents values in US$ billions, while the right-hand panel depicts their respective share of total UN system revenue. As can be seen, changes in overall funding volumes since 2015 have primarily been driven by fluctuations in earmarked contributions. Thus, earmarked contributions, and to a lesser extent other resources, have helped expand the UN’s funding base. On the other hand, assessed resources have remained relatively stable in absolute terms, leading to a decline in their share of total UN system funding from 30% in 2015 to 20% in 2024. Meanwhile, voluntary core resources have remained in the 8–10% range. Overall, these figures reflect a long-term trend in UN funding towards greater reliance on non-core resources.
Distribution of UN system funding by financing instrument, 2015–2024 (US$ billion)
Source: Chief Executives Board for Coordination (CEB)
Assessed and voluntary core contributions together constitute core resources, the most flexible funding modality. Core resources reinforce the UN system’s multilateral character and impartiality, ensuring that funding for essential operational activities and enabling functions can be carried out independently of donor preferences.
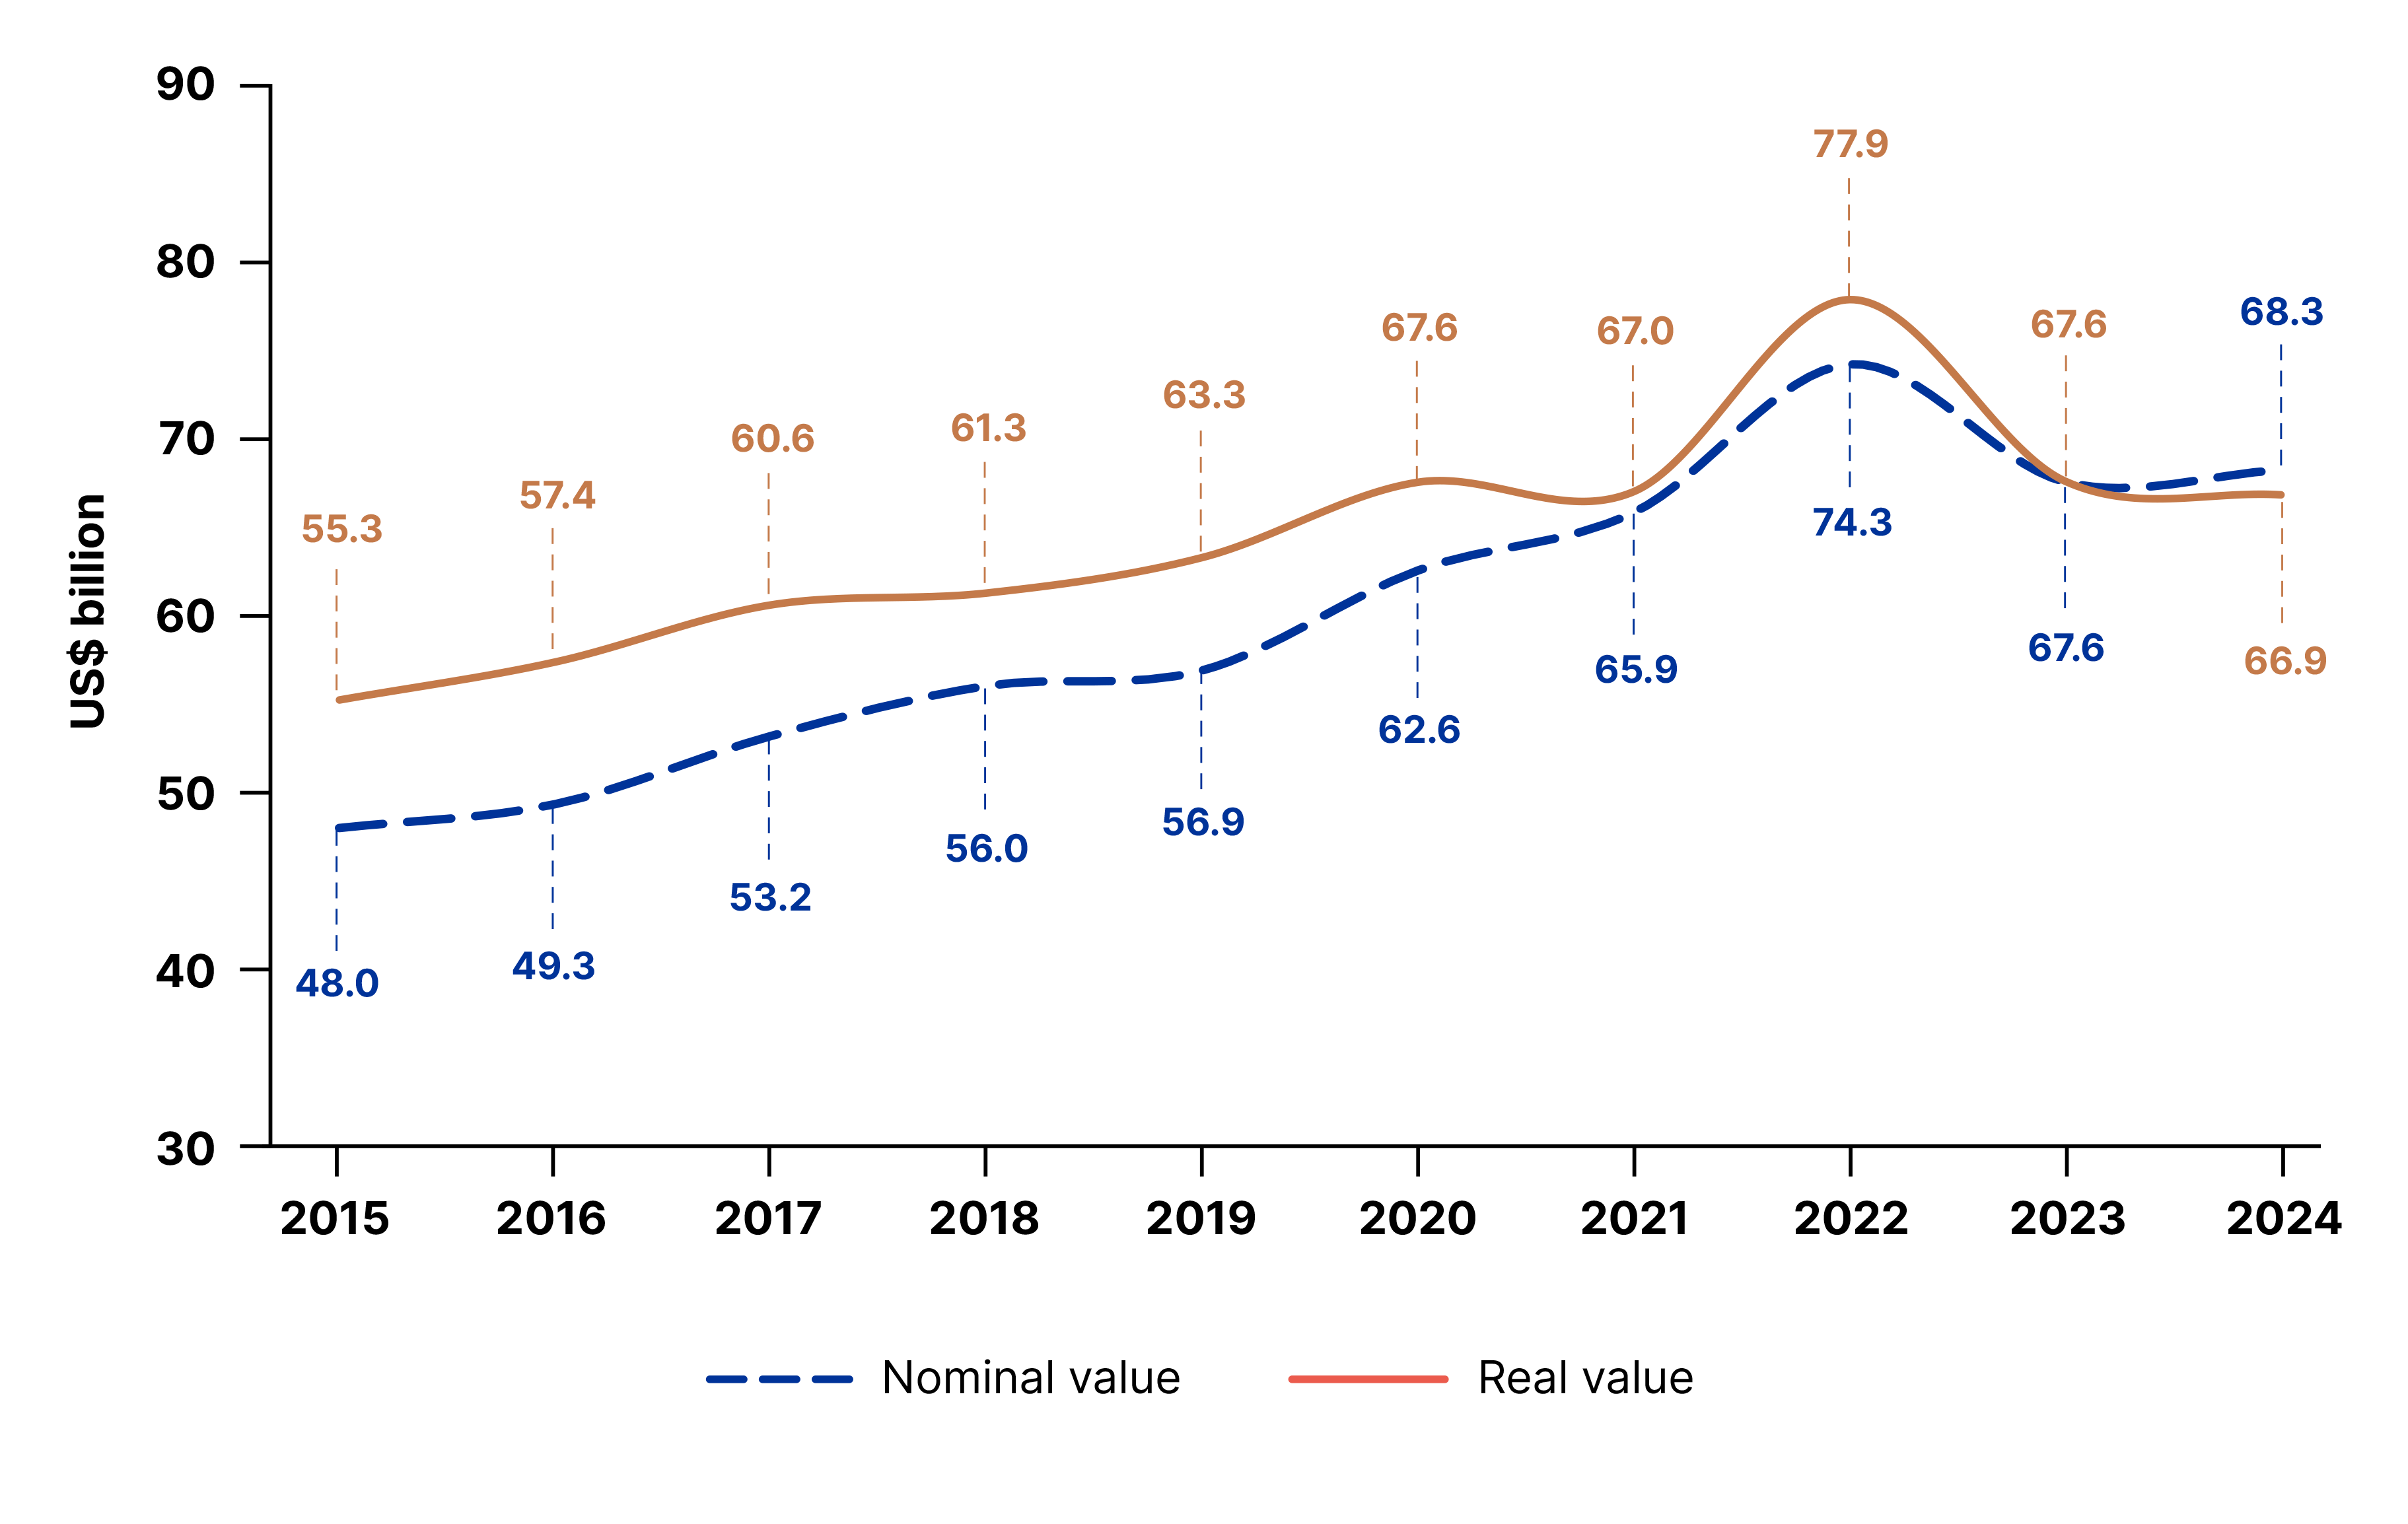
Figure 3 illustrates the evolution of total UN system funding over the 2015–2024 period, comparing nominal values (current prices) with real values (adjusted for inflation and exchange rate fluctuations to reflect constant purchasing power). In 2024, UN system funding in real terms was US$ 66.9 billion. This not only reflected a decline of US$ 0.7 billion in purchasing power compared to the previous year, but a total revenue level lower than that of 2020. Looking at trends since the adoption of the SDGs in 2015, the overall growth rate for 2015–2024 was 42% in nominal terms, but just half that (21%) in real terms. Given the projected decline in nominal revenue to US$ 54.3 billion by 2027, UN total revenue will likely be several percentage points lower in real terms in 2027 compared to 2015.
UN system funding, 2015–2024: Nominal values at current prices and real values at constant 2023 prices (US$ billion)
Source: Chief Executives Board for Coordination (CEB) and Organisation for Economic Co-operation and Development (OECD).
Note: Deflator for resource flows from OECD-DAC countries (2023=100), which takes into account both inflation and exchange rate movements.