The data presented thus far has encompassed all entities reporting to the CEB – in other words, the entire UN system. From here on, the chapter shifts focus to the UNDS, using data from the UN Department of Economic and Social Affairs (UN DESA). The UNDS is a subgroup of the UN system, comprising entities mandated to promote sustainable development and human welfare in developing countries and countries in transition. More specifically, these entities focus on development and humanitarian assistance, which are together referred to as UN operational activities for development (OAD) (see Box 2 in Chapter 2).
Core and earmarked revenues
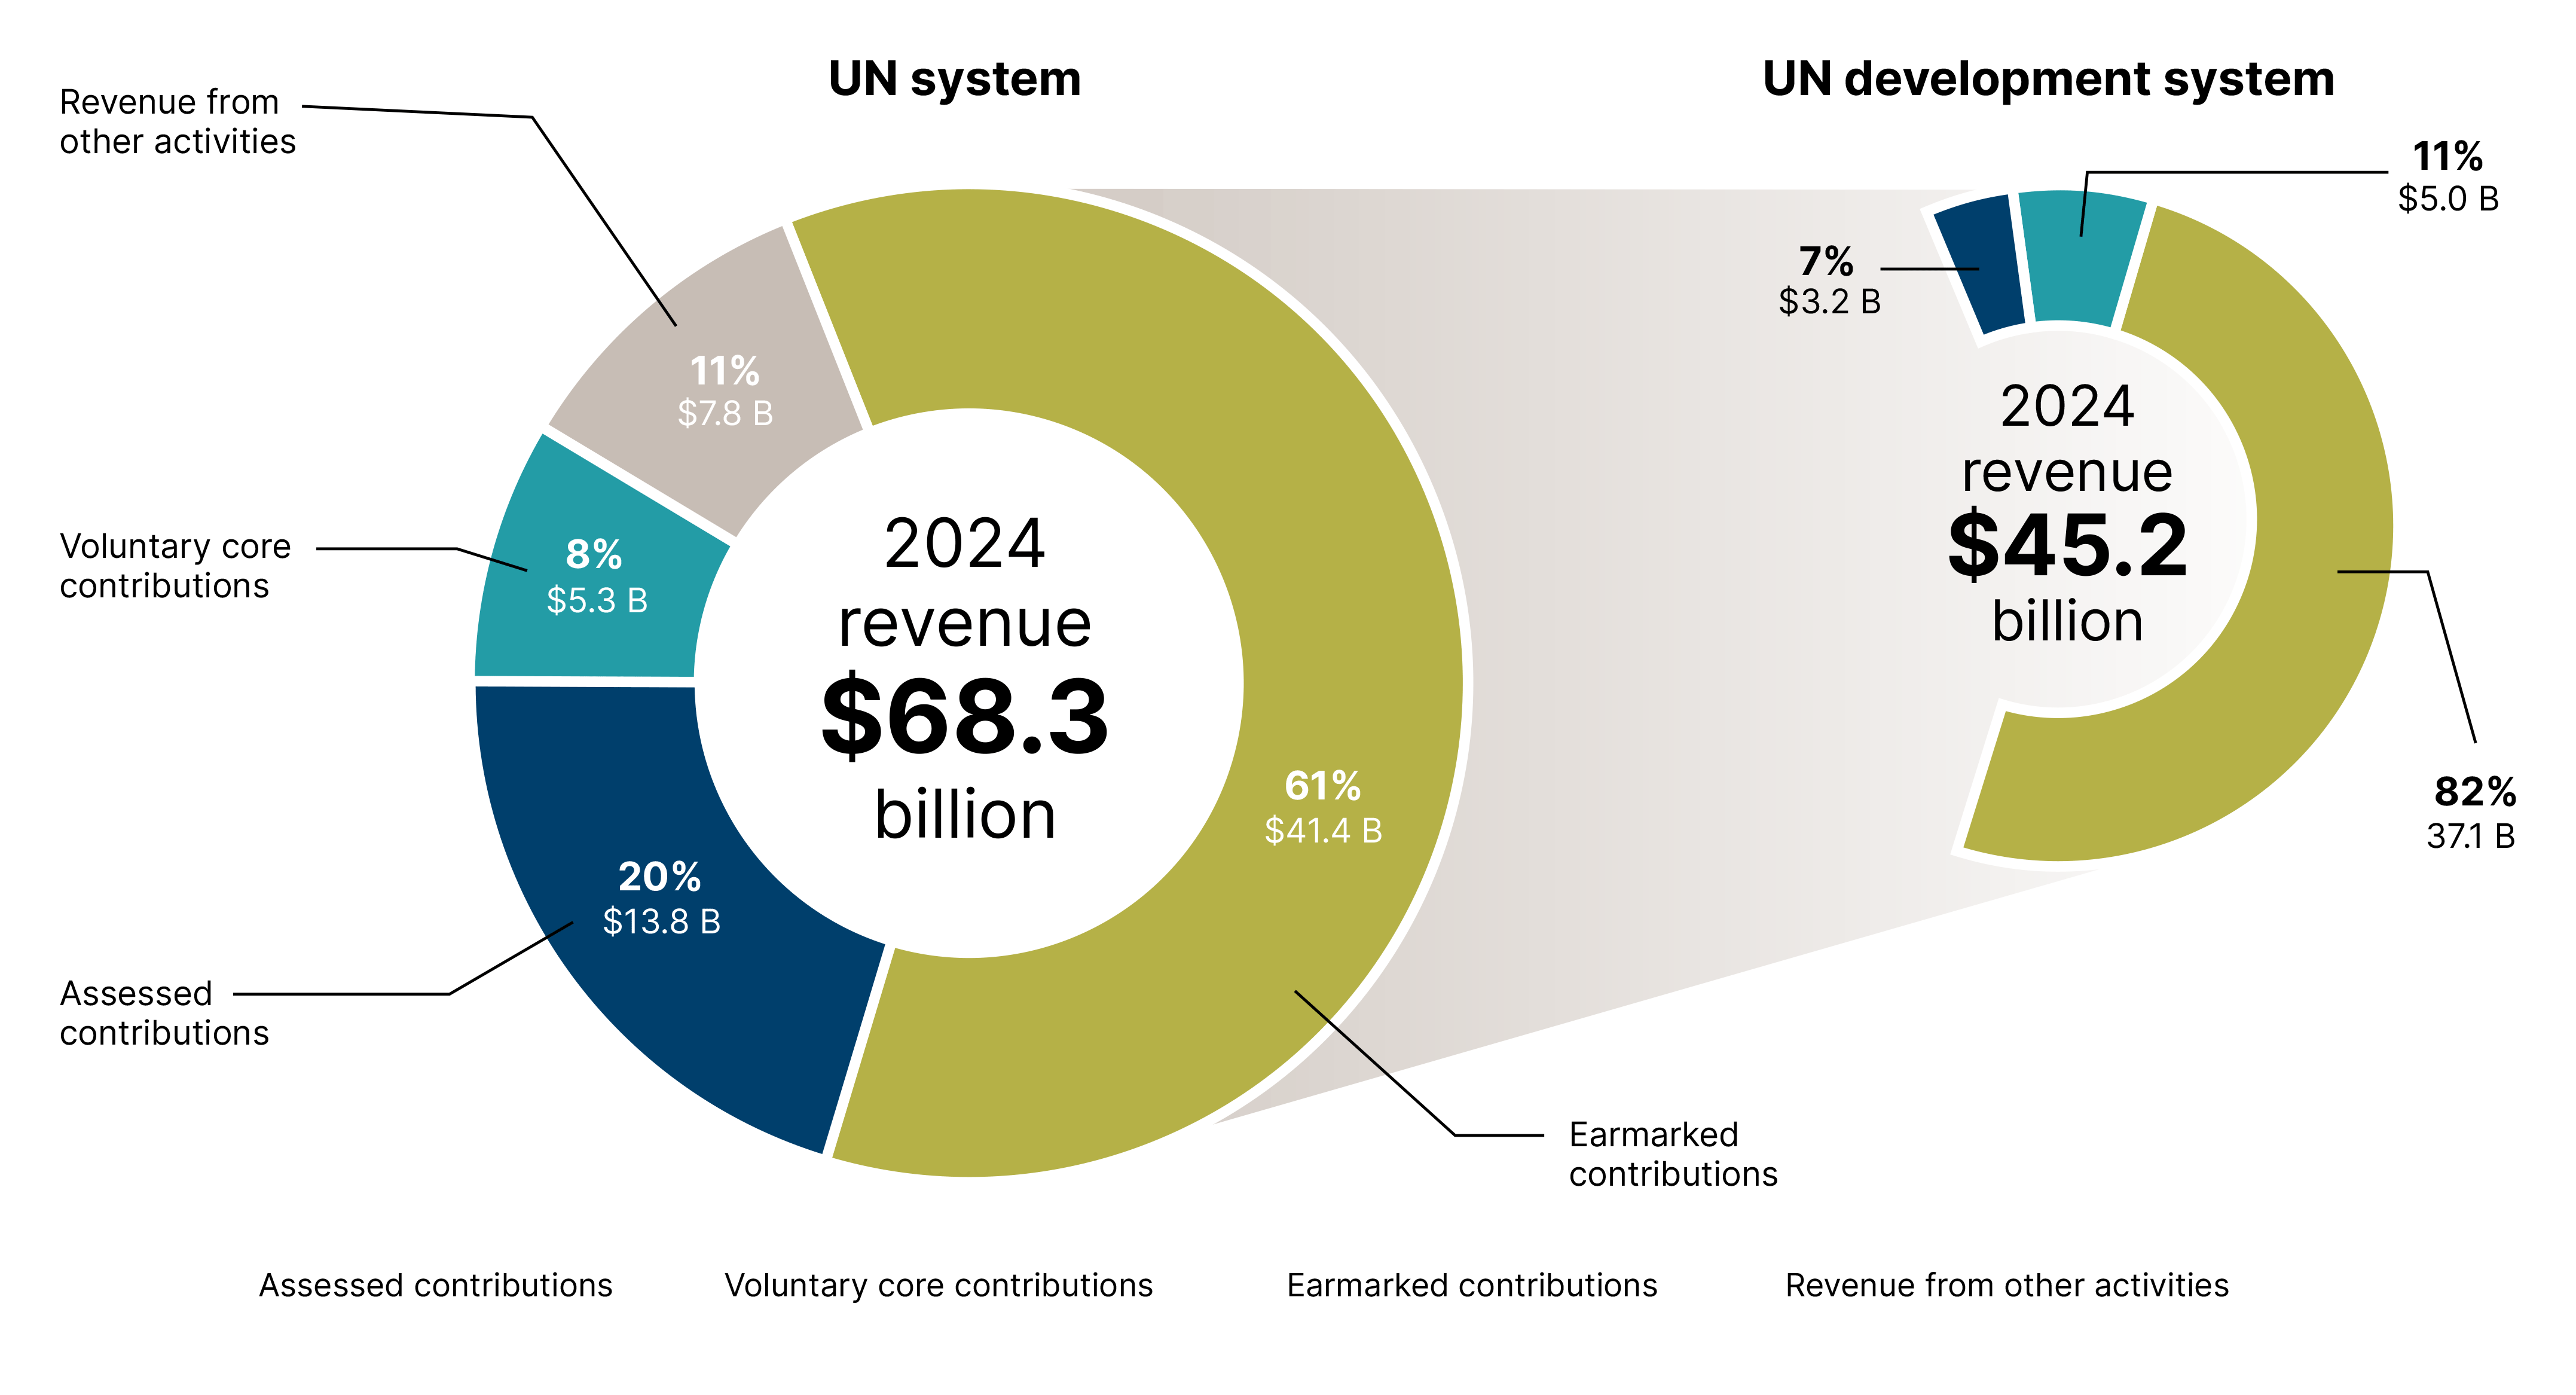
Figure 13 depicts the 2024 revenues of both the UN system and the UNDS, including their composition and the relationship between them. Contributions to the UNDS totalled US$ 45.2 billion, accounting for 66% of total UN system revenue. This was the lowest level seen since 2021, representing a 17% decrease from the 2022 peak of US$ 54.5 billion. Breaking down total contributions to UN development and humanitarian assistance in 2024, 82% were earmarked contributions (US$ 37.1 billion), 11% voluntary core contributions (US$ 5.0 billion) and the remaining 7% assessed contributions (US$ 3.2 billion). Overall, core contributions to the UNDS accounted for only 18% of total revenues in 2024.
Funding of the UN system and UN development system by financing instrument, 2024 (US$ billion)
Source: Chief Executives Board for Coordination (CEB) and Report of the Secretary-General (A/81/75/Add.1-E/2026/61/Add.1).
Figure 14 illustrates the evolution of contributions to the UNDS from 2015 to 2024, disaggregated into core and earmarked contributions. As in the broader UN system, fluctuations in UNDS revenue during this period were largely driven by earmarked funding, which increased from US$ 22.1 billion in 2015 to a peak of US$ 45.6 billion in 2022, before declining to US$ 37.1 billion in 2024. By contrast, core contributions have remained relatively stable over the period, rising steadily from US$ 6.4 billion in 2015 to US$ 9.7 billion in 2021. Since then, however, core funding for UN OAD has declined, falling to US$ 8.2 billion in 2024. This decrease is mainly explained by reductions in voluntary core resources, together with non-payment of assessed contributions by some Member States.
OECD projections suggest core contributions to the UNDS may have declined by 27% in 2025 compared to 2024.34 If current estimates hold, this means core contributions to the UNDS have fallen, in nominal terms, to around US$ 6 billion, below the level recorded at any point in the 2015–2024 period.
The gap between core and earmarked funding has widened over the past decade. This growing disparity poses a significant challenge to the UNDS’s capacity. Not only does it limit the ability to respond flexibly, effectively and in a coordinated manner to programme country needs, it constrains investments in long-term development solutions. As highlighted in the 2024 Report of the Secretary-General, ‘When non-core funding accounts for a high proportion of overall funding, it can lead to the fragmentation of resources, especially if the non-core resources are tightly earmarked for specific projects. High proportions of non-core funding can also promote a culture of United Nations entities competing for donor resources’.35
The revitalised funding compact, endorsed by the UN Economic and Social Council (ECOSOC) in July 2024, sets out a number of concrete commitments between Member States and the UNDS aimed at improving funding quality for development assistance. These include increasing the share of core contributions, as well as expanding flexible and multi-year funding. As part of this, the UNDS has pledged to strengthen system-wide transparency, efficiency and results reporting.36
More specifically, the funding compact set a target that core funding provided by Member States should constitute at least 30% of total voluntary funding across the UNDS (excluding assessed contributions) by 2027. In 2024, total voluntary funding amounted to US$ 42 billion, of which US$ 37.1 billion was earmarked and just US$ 5 billion was voluntary core – an 11.8% share. As noted in the 2026 Report of the Secretary-General, ‘Despite two iterations of the funding compact, the anticipated shift towards core, pooled and flexible financing has not materialised in any meaningful way. Core funding has not reached 30 per cent of total voluntary contributions, and for some agencies it has fallen below 10 per cent’.37
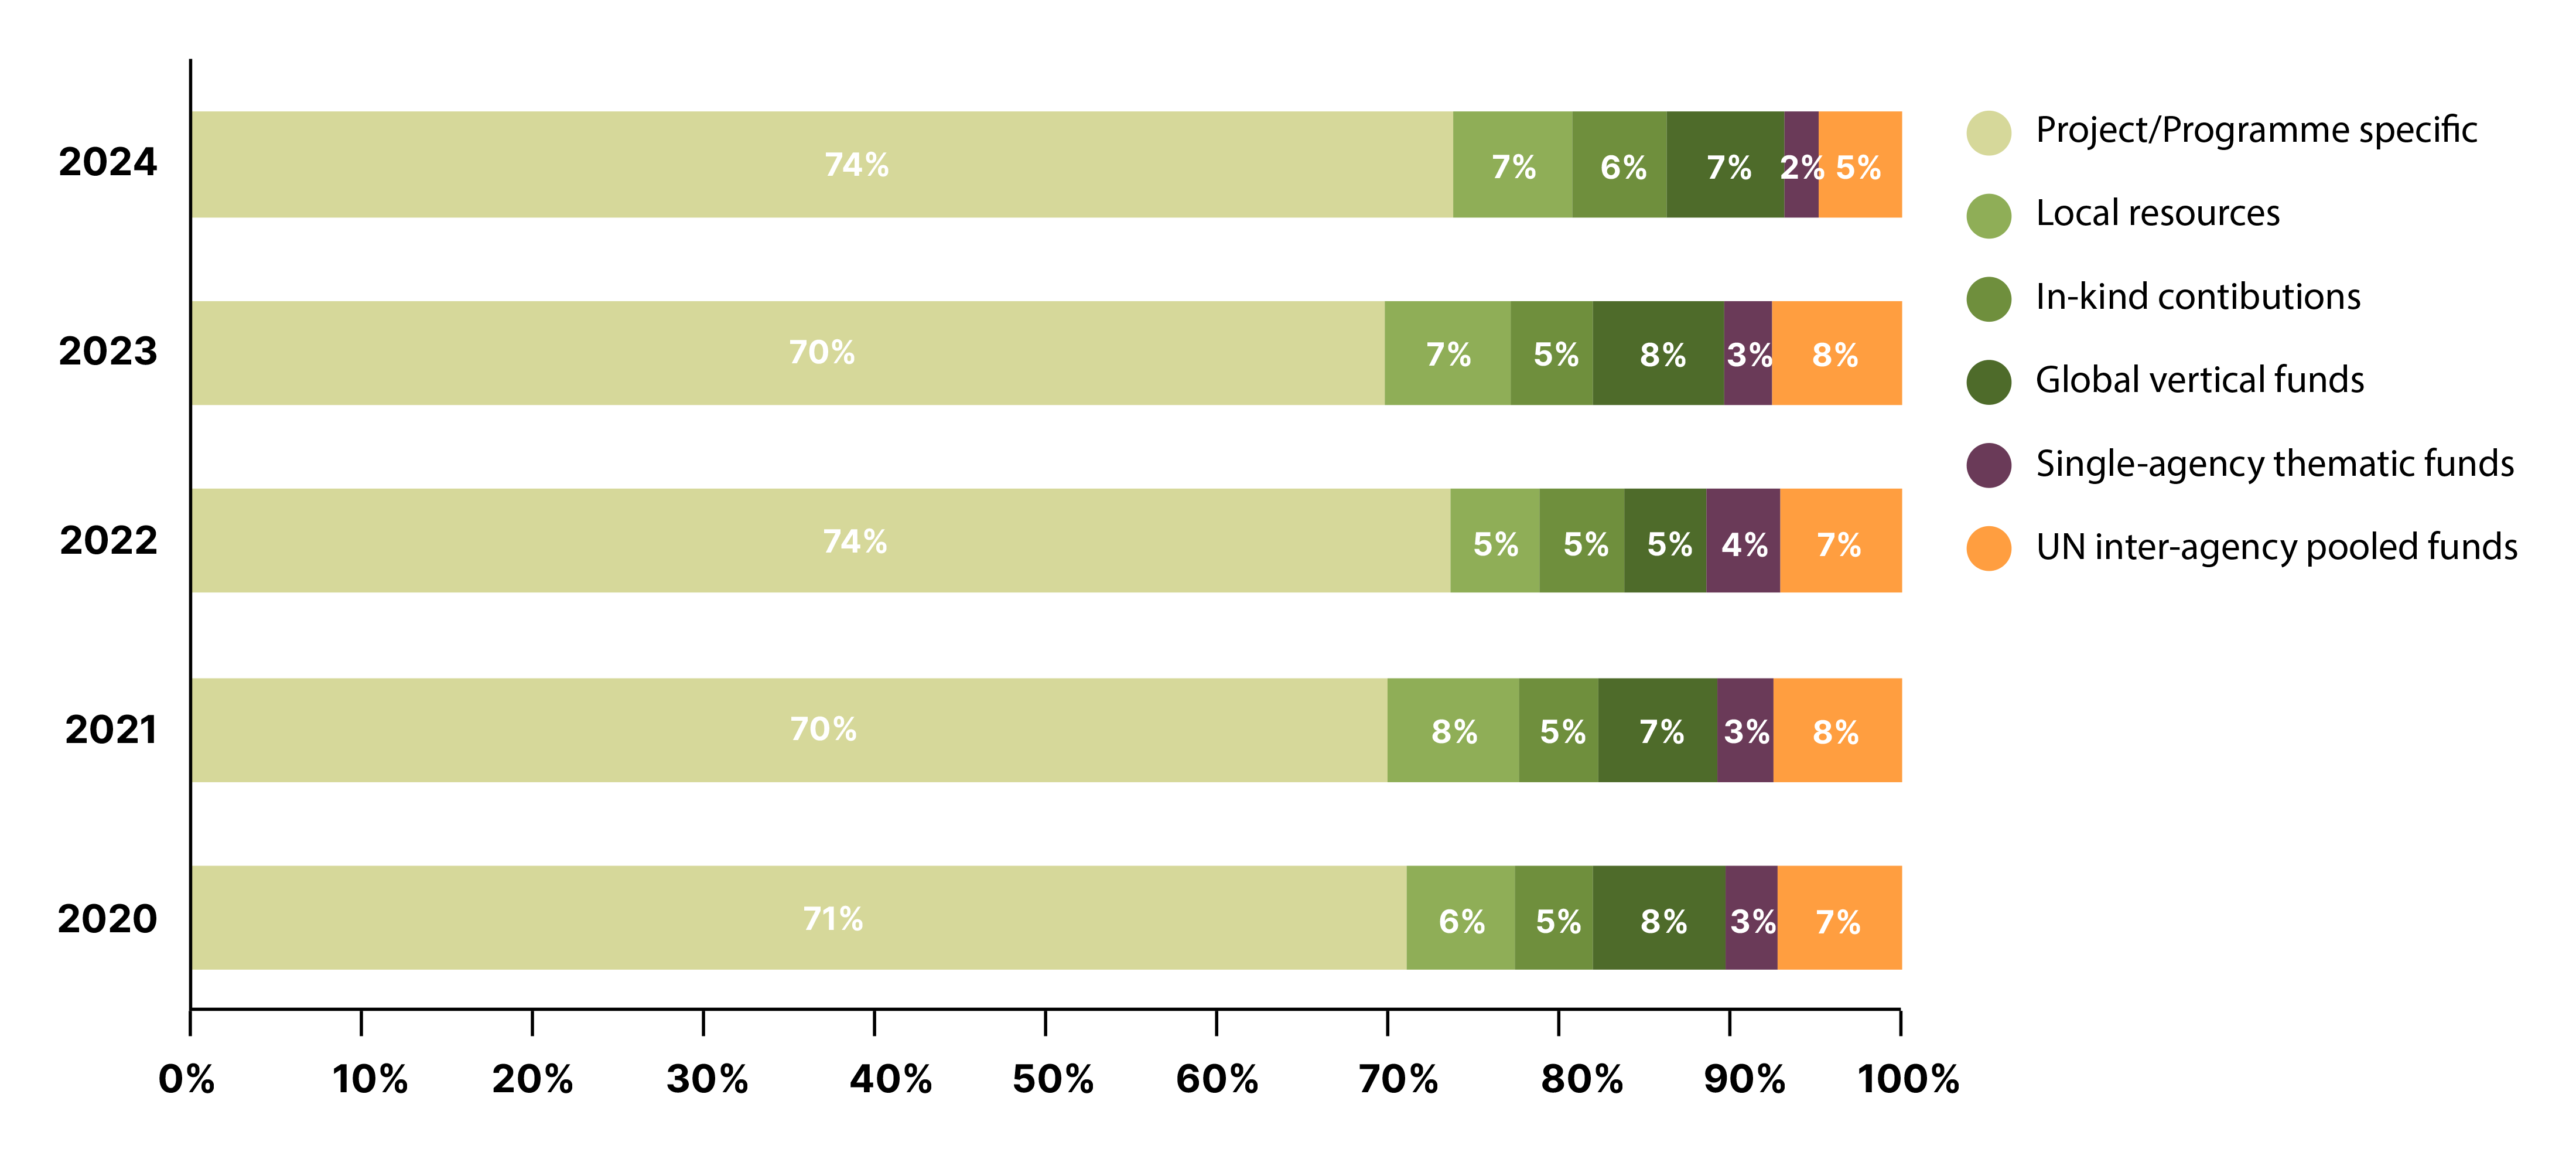
Figure 15 shows the annual distribution of earmarked contributions to the UNDS by type from 2020 to 2024.38 As noted in section 1.2, earmarked contribution types range from project-/programme-specific contributions that are for the most part tightly earmarked, to the more flexible modality of UN inter-agency pooled funds.
The horizontal bars in Figure 15 show each type of earmarked contribution as a percentage of total UNDS earmarked contributions. As can be seen, funding throughout this period was concentrated in earmarked projects/programmes, which consistently accounted for 70–74% of total earmarked resources. By contrast, more flexible funding modalities represent only a small share of earmarked resources, underscoring the structural nature of this concentration.
Tightly earmarked project- or programme-specific funding incurs high transaction costs and can lead to reporting duplication. It may also intensify competition between UN entities for funding from major Member State contributors, particularly in the context of constrained core resources. In 2024, 57% of the contributor governments surveyed reported an increase in such competition among UN entities.39
Earmarked contributions to the UN development system by type, 2020–2024 (percentage share of earmarked UNDS contributions)
Source: Report of the Secretary-General (A/81/75/Add.1-E/2026/61/Add.1). Historical data from various reports.
UNDS top contributors
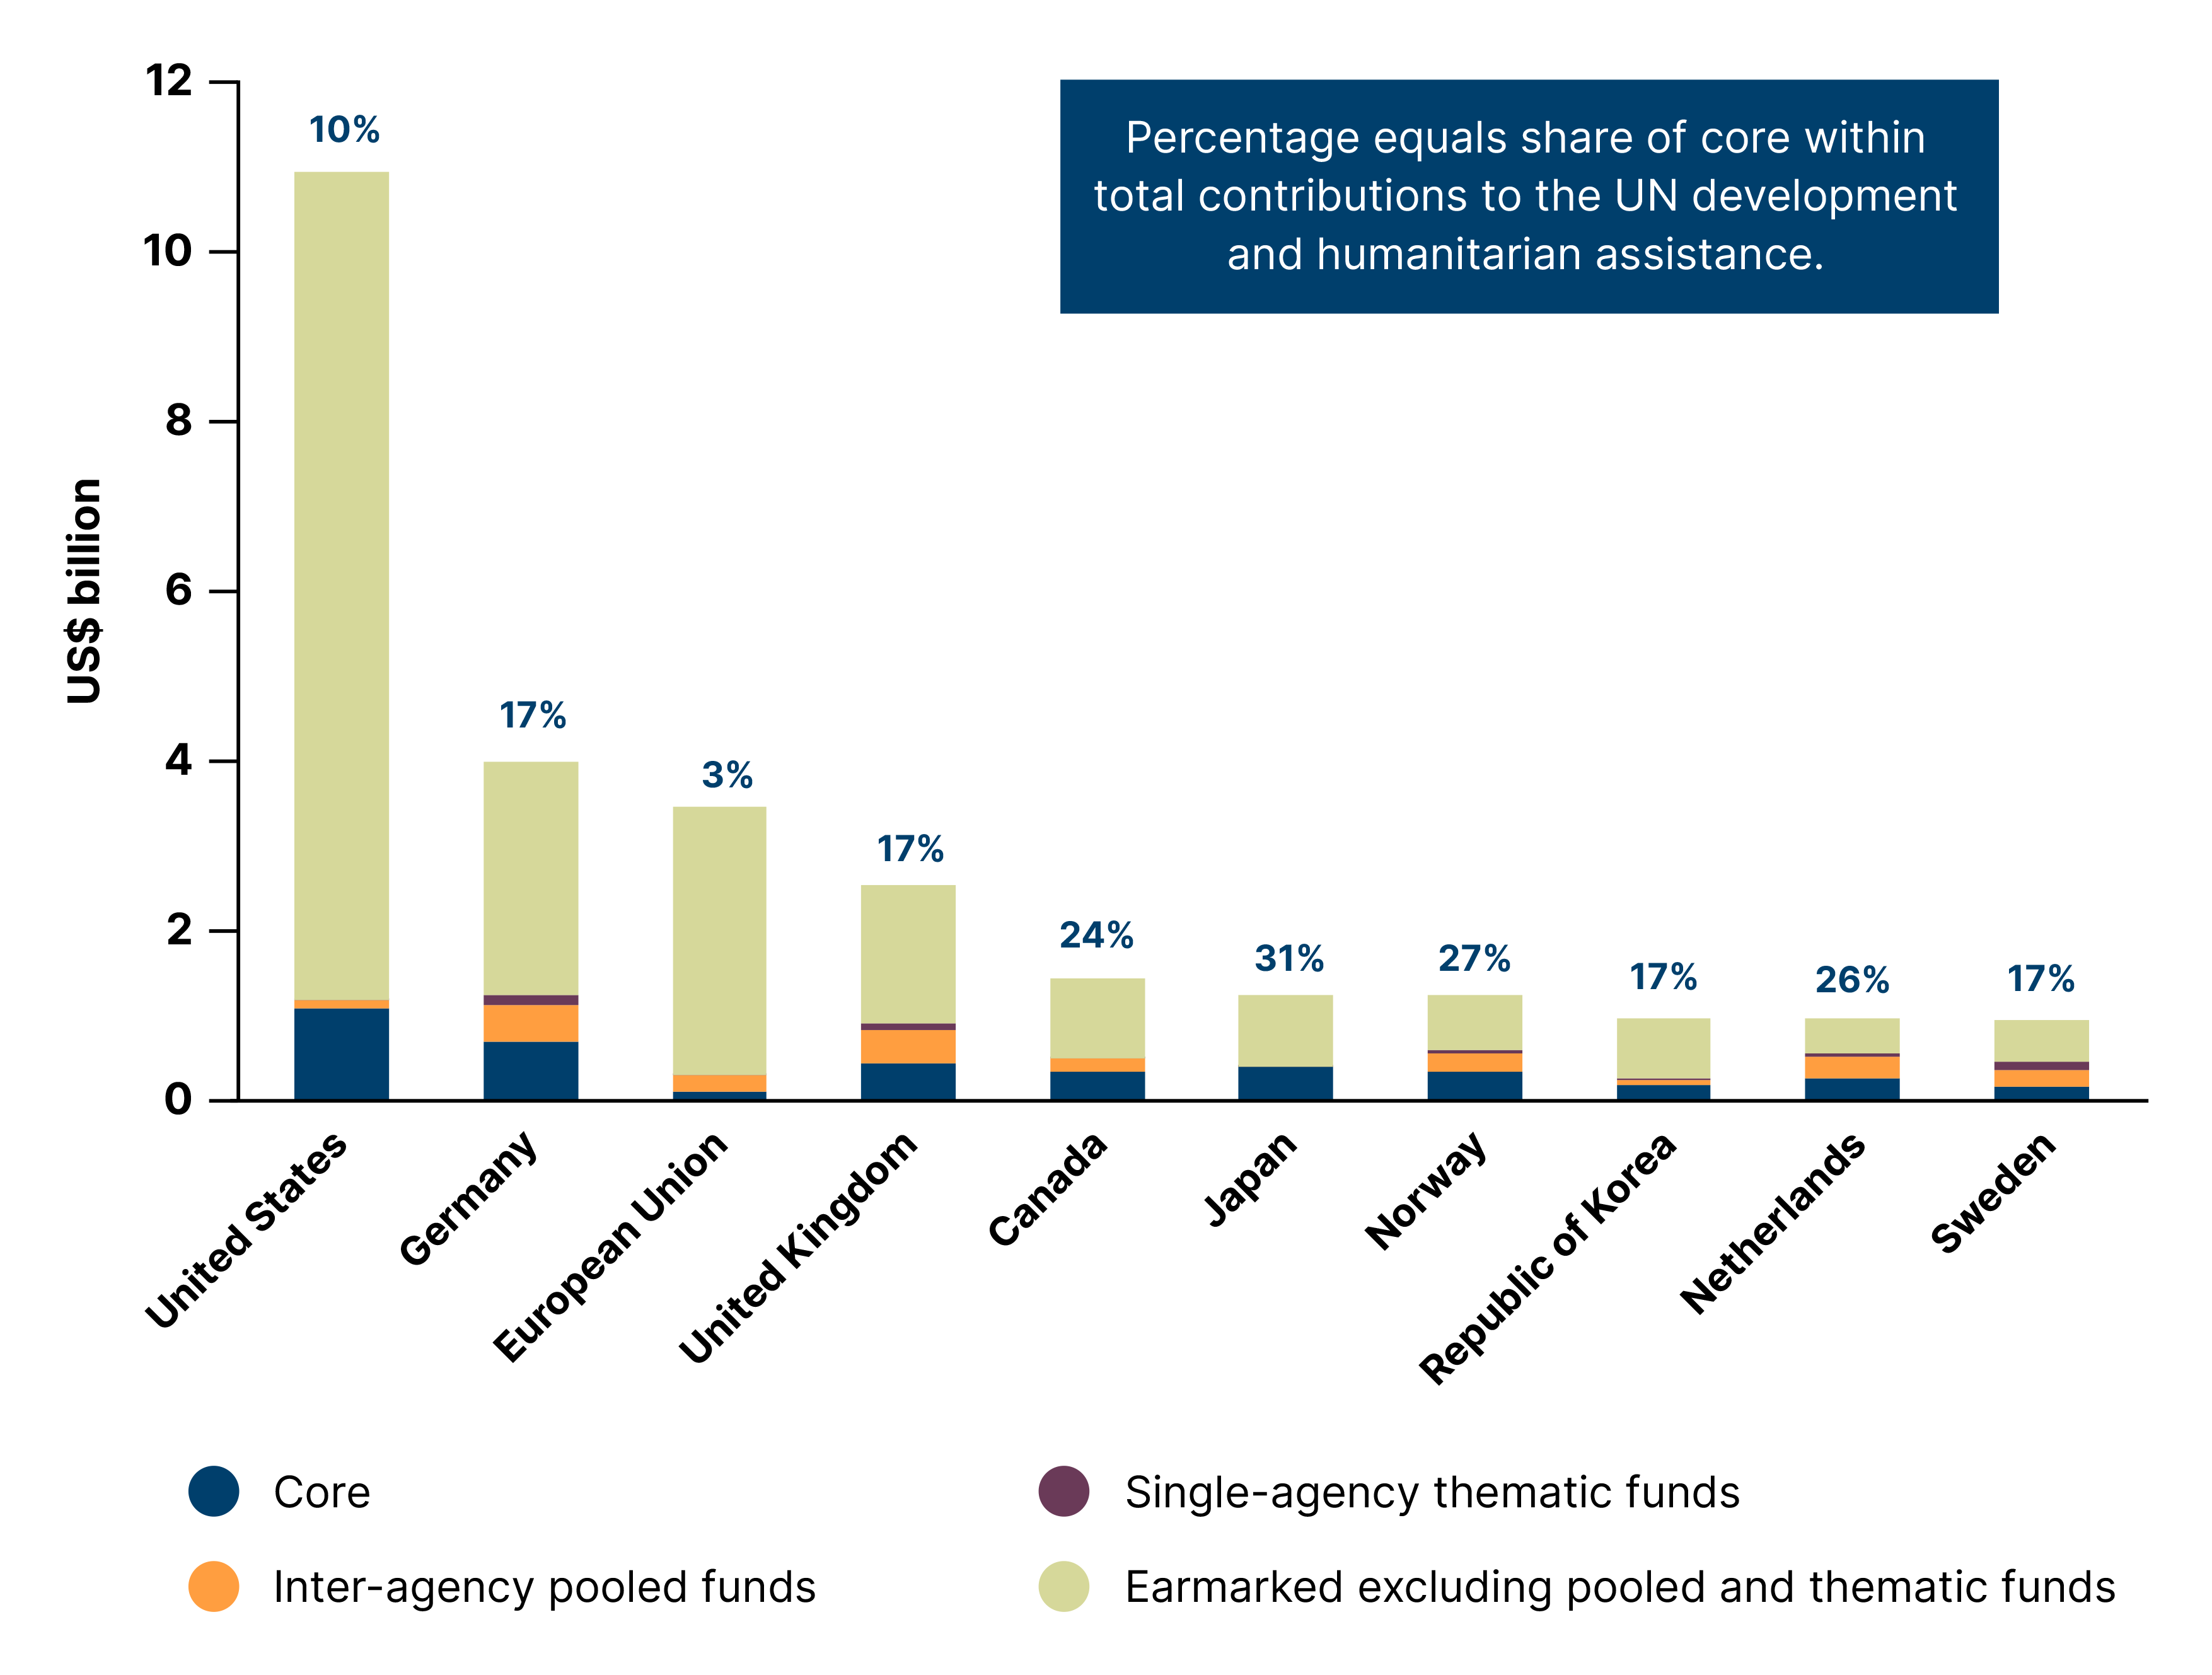
Like the UN system, the UNDS relies heavily on a small number of contributors, with the top ten OECD-DAC contributors collectively accounting for 61% of total UN OAD funding in 2024. There are, however, notable variations in the financing instruments these donors rely on, as illustrated in Figure 16. The percentage labels indicate the share of core within each total contribution to the UNDS, while earmarked resources are further broken down into single-agency thematic funds and inter-agency pooled funds. As noted above, the EU’s legal and institutional status as a political and economic union of member states means it mainly provides earmarked contributions.40
Germany, the United Kingdom, Norway, the Netherlands and Sweden show more diversified funding profiles, with notable shares of pooled and thematic funds offering a valuable complement to core resources. The United States remained the largest donor in 2024 in absolute terms, contributing close to US$ 11 billion, 10% of which was provided as core resources. Japan provided the highest share of total core funding (31%), while Norway had the highest share of voluntary core (25%).
Excluding assessed contributions, Germany is the largest provider of voluntary core funding at US$ 495 million, followed by the United States at US$ 448 million. Next comes Norway with US$ 309 million and the United King dom with US$ 304 million. Of these four countries, only Norway’s contribution to the UN’s core resources is expected to remain stable in 2025 according to OECD projections, with a significant drop in such contributions anticipated among the other three.
Funding composition for UN development and humanitarian assistance: Top OECD-DAC contributors, 2024 (US$ billion)
Source: Report of the Secretary-General (A/81/75/Add.1-E/2026/61/Add.1).
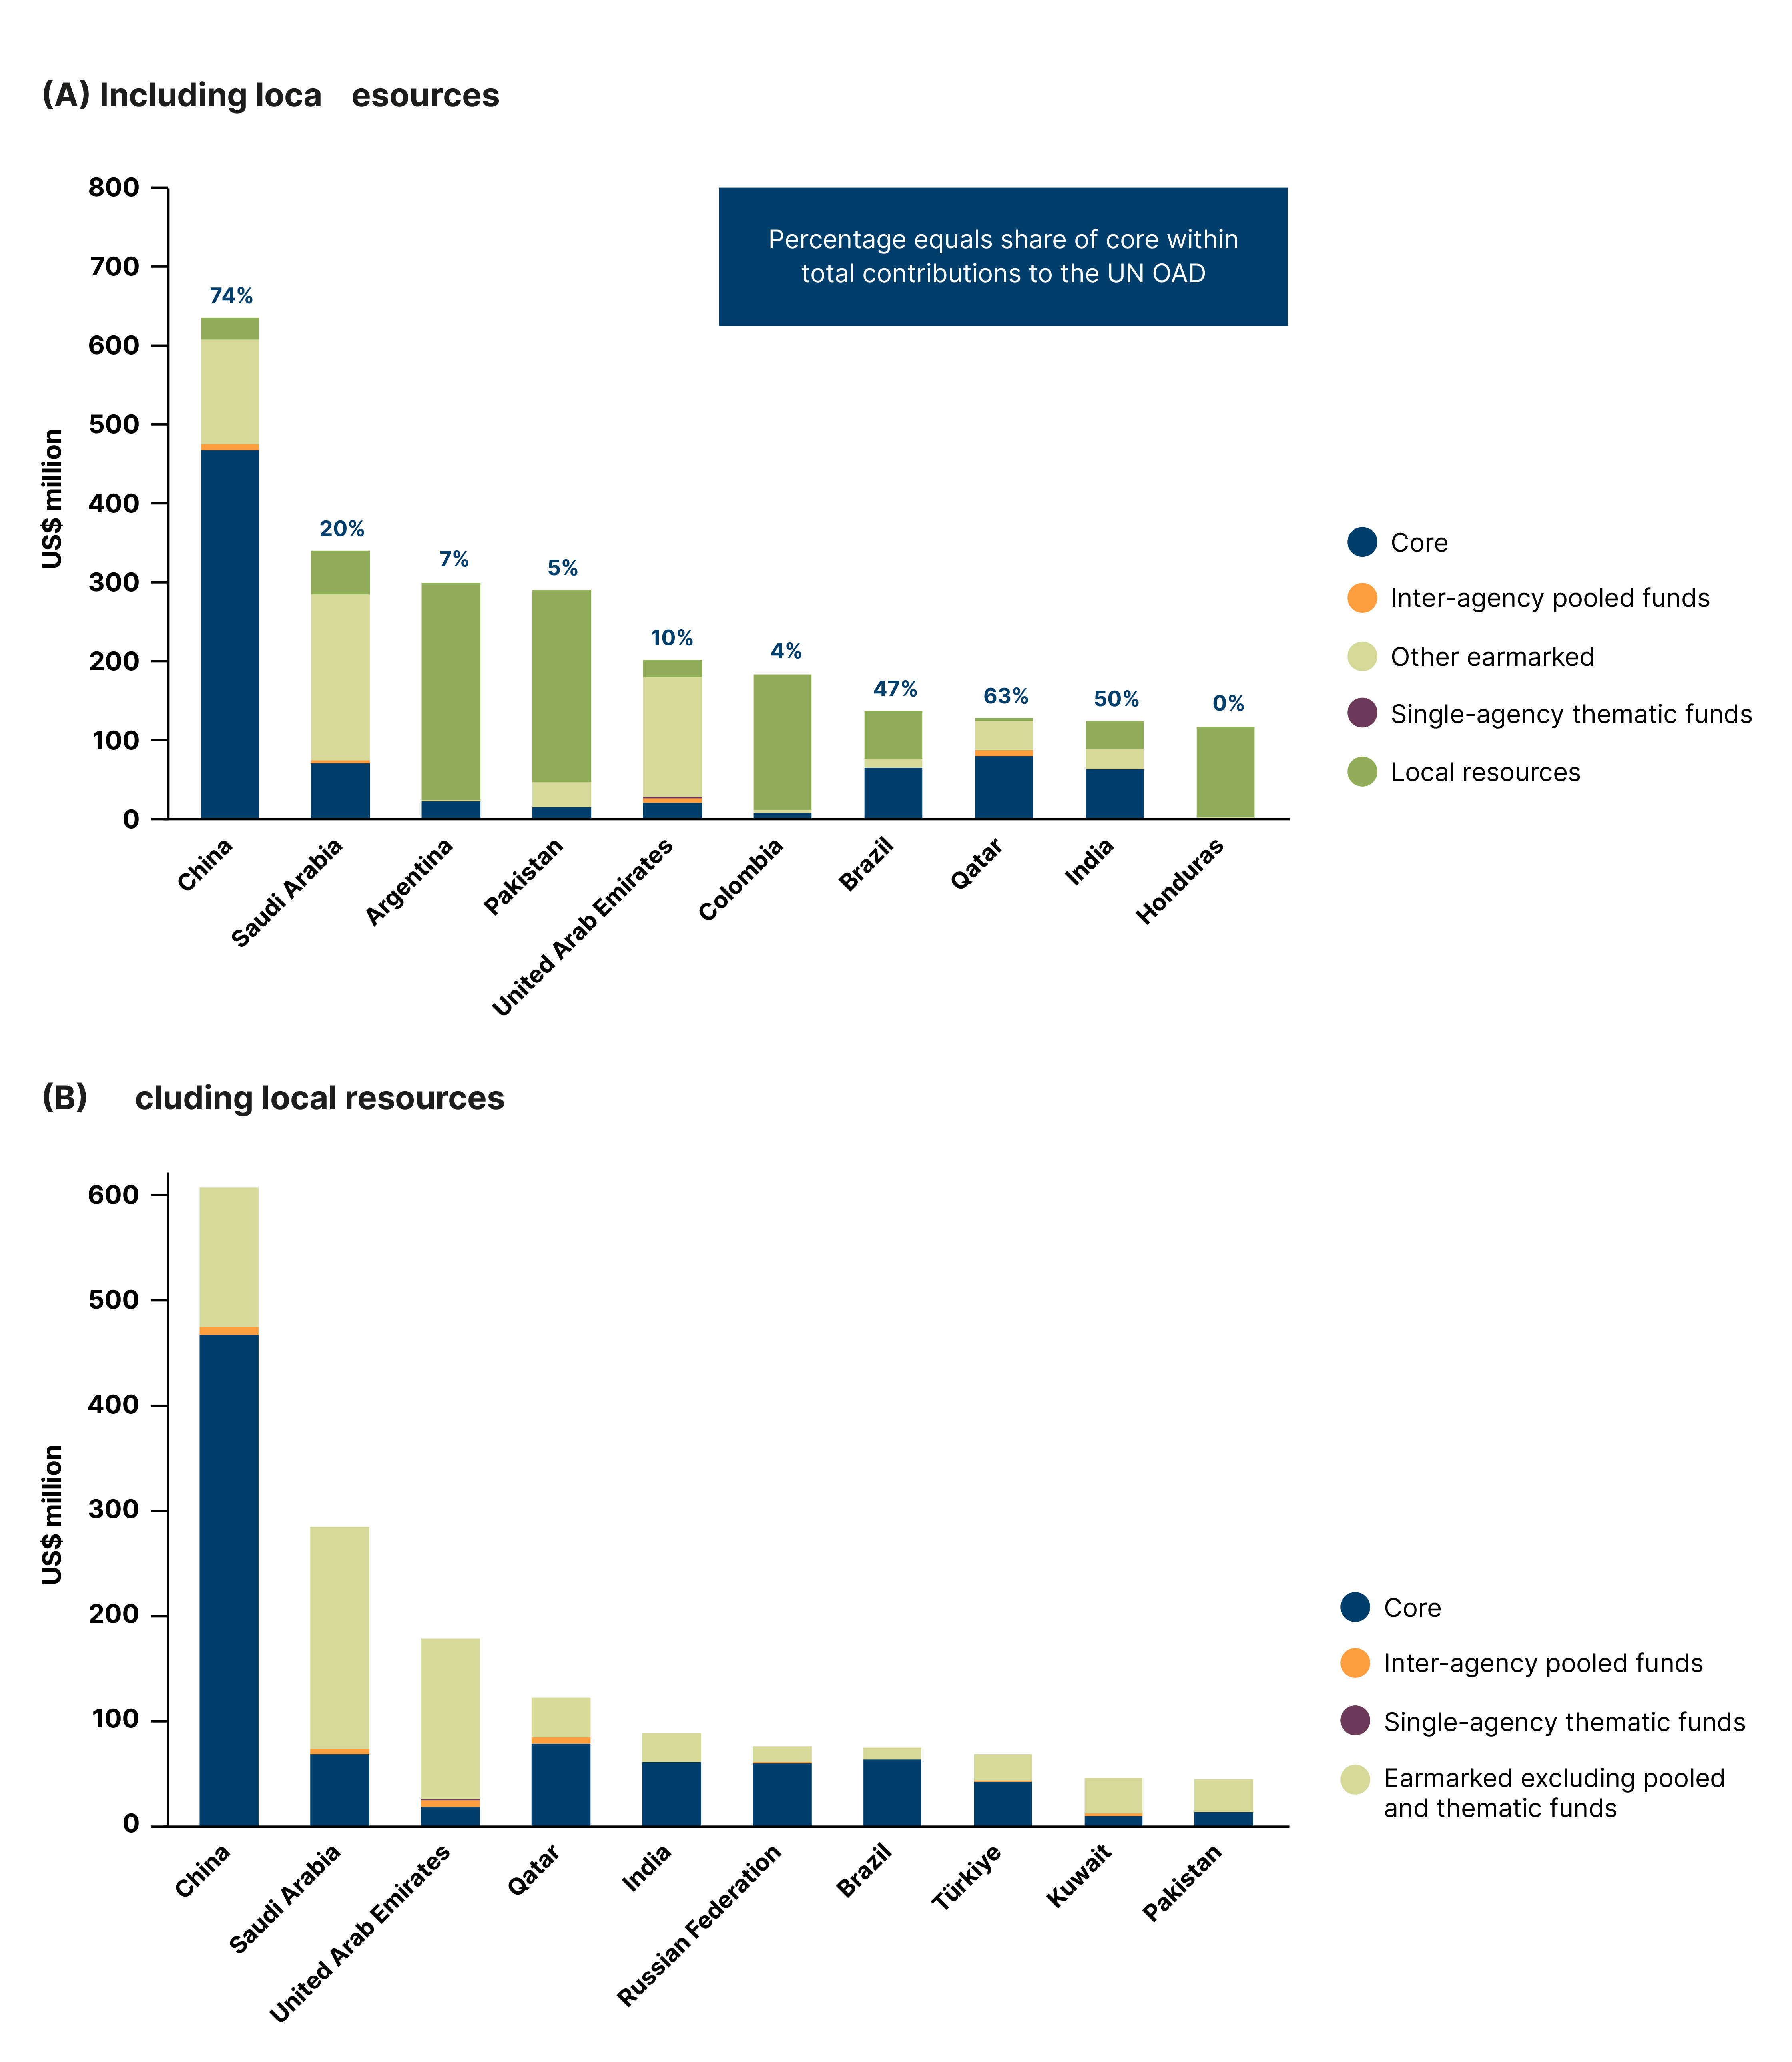
Emerging donors also exhibit a diverse funding mix for UN development and humanitarian activities. Most contribute lower volumes of earmarked resources than DAC countries, which translates into a comparatively higher share of core funding. The two panels in Figure 17 present the contributions of the top non-OECD-DAC member states contributors to UN OAD in 2024, distinguishing between funding that includes/excludes local resources.
China remained the largest non-OECD-DAC contributor to UN development and humanitarian assistance in 2024, regardless of whether local resources were included or excluded (see Box 1 for the definition of local resources). It provided US$ 636 million including local resources, of which 74% was core funding and 6% (US$ 40 million) voluntary core. Elsewhere, Qatar stands out, with 63% of its total contributions provided as core resources. Moreover, it contributed the highest amount of voluntary core (US$ 74 million) among this group of contributors. Other major contributors, including Saudi Arabia and the United Arab Emirates, channelled their support primarily through earmarked funding.
Excluding local resources has a notable impact on the top non-OECD-DAC contributors’ composition and ranking – more than 90% of contributions to the UNDS from Honduras, Colombia and Argentina consist of local resources.41 In addition, non-OECD-DAC contributors have had limited engagement in funding UN inter-agency pooled funds. In 2024, China, Qatar and United Arab Emirates were the largest contributors among this group, providing US$ 7.4 million, US$ 6.8 million and US$ 6.4 million respectively.
Funding composition for UN development and humanitarian assistance: Top non-OECD-DAC contributors, 2024 (US$ million)
Source: Report of the Secretary-General (A/81/75/Add.1-E/2026/61/Add.1).
Note: Project/programme-specific funding, global vertical funds, and in-kind contributions are included under the category ‘Other Earmarked’.
UNDS top contributors to development activities
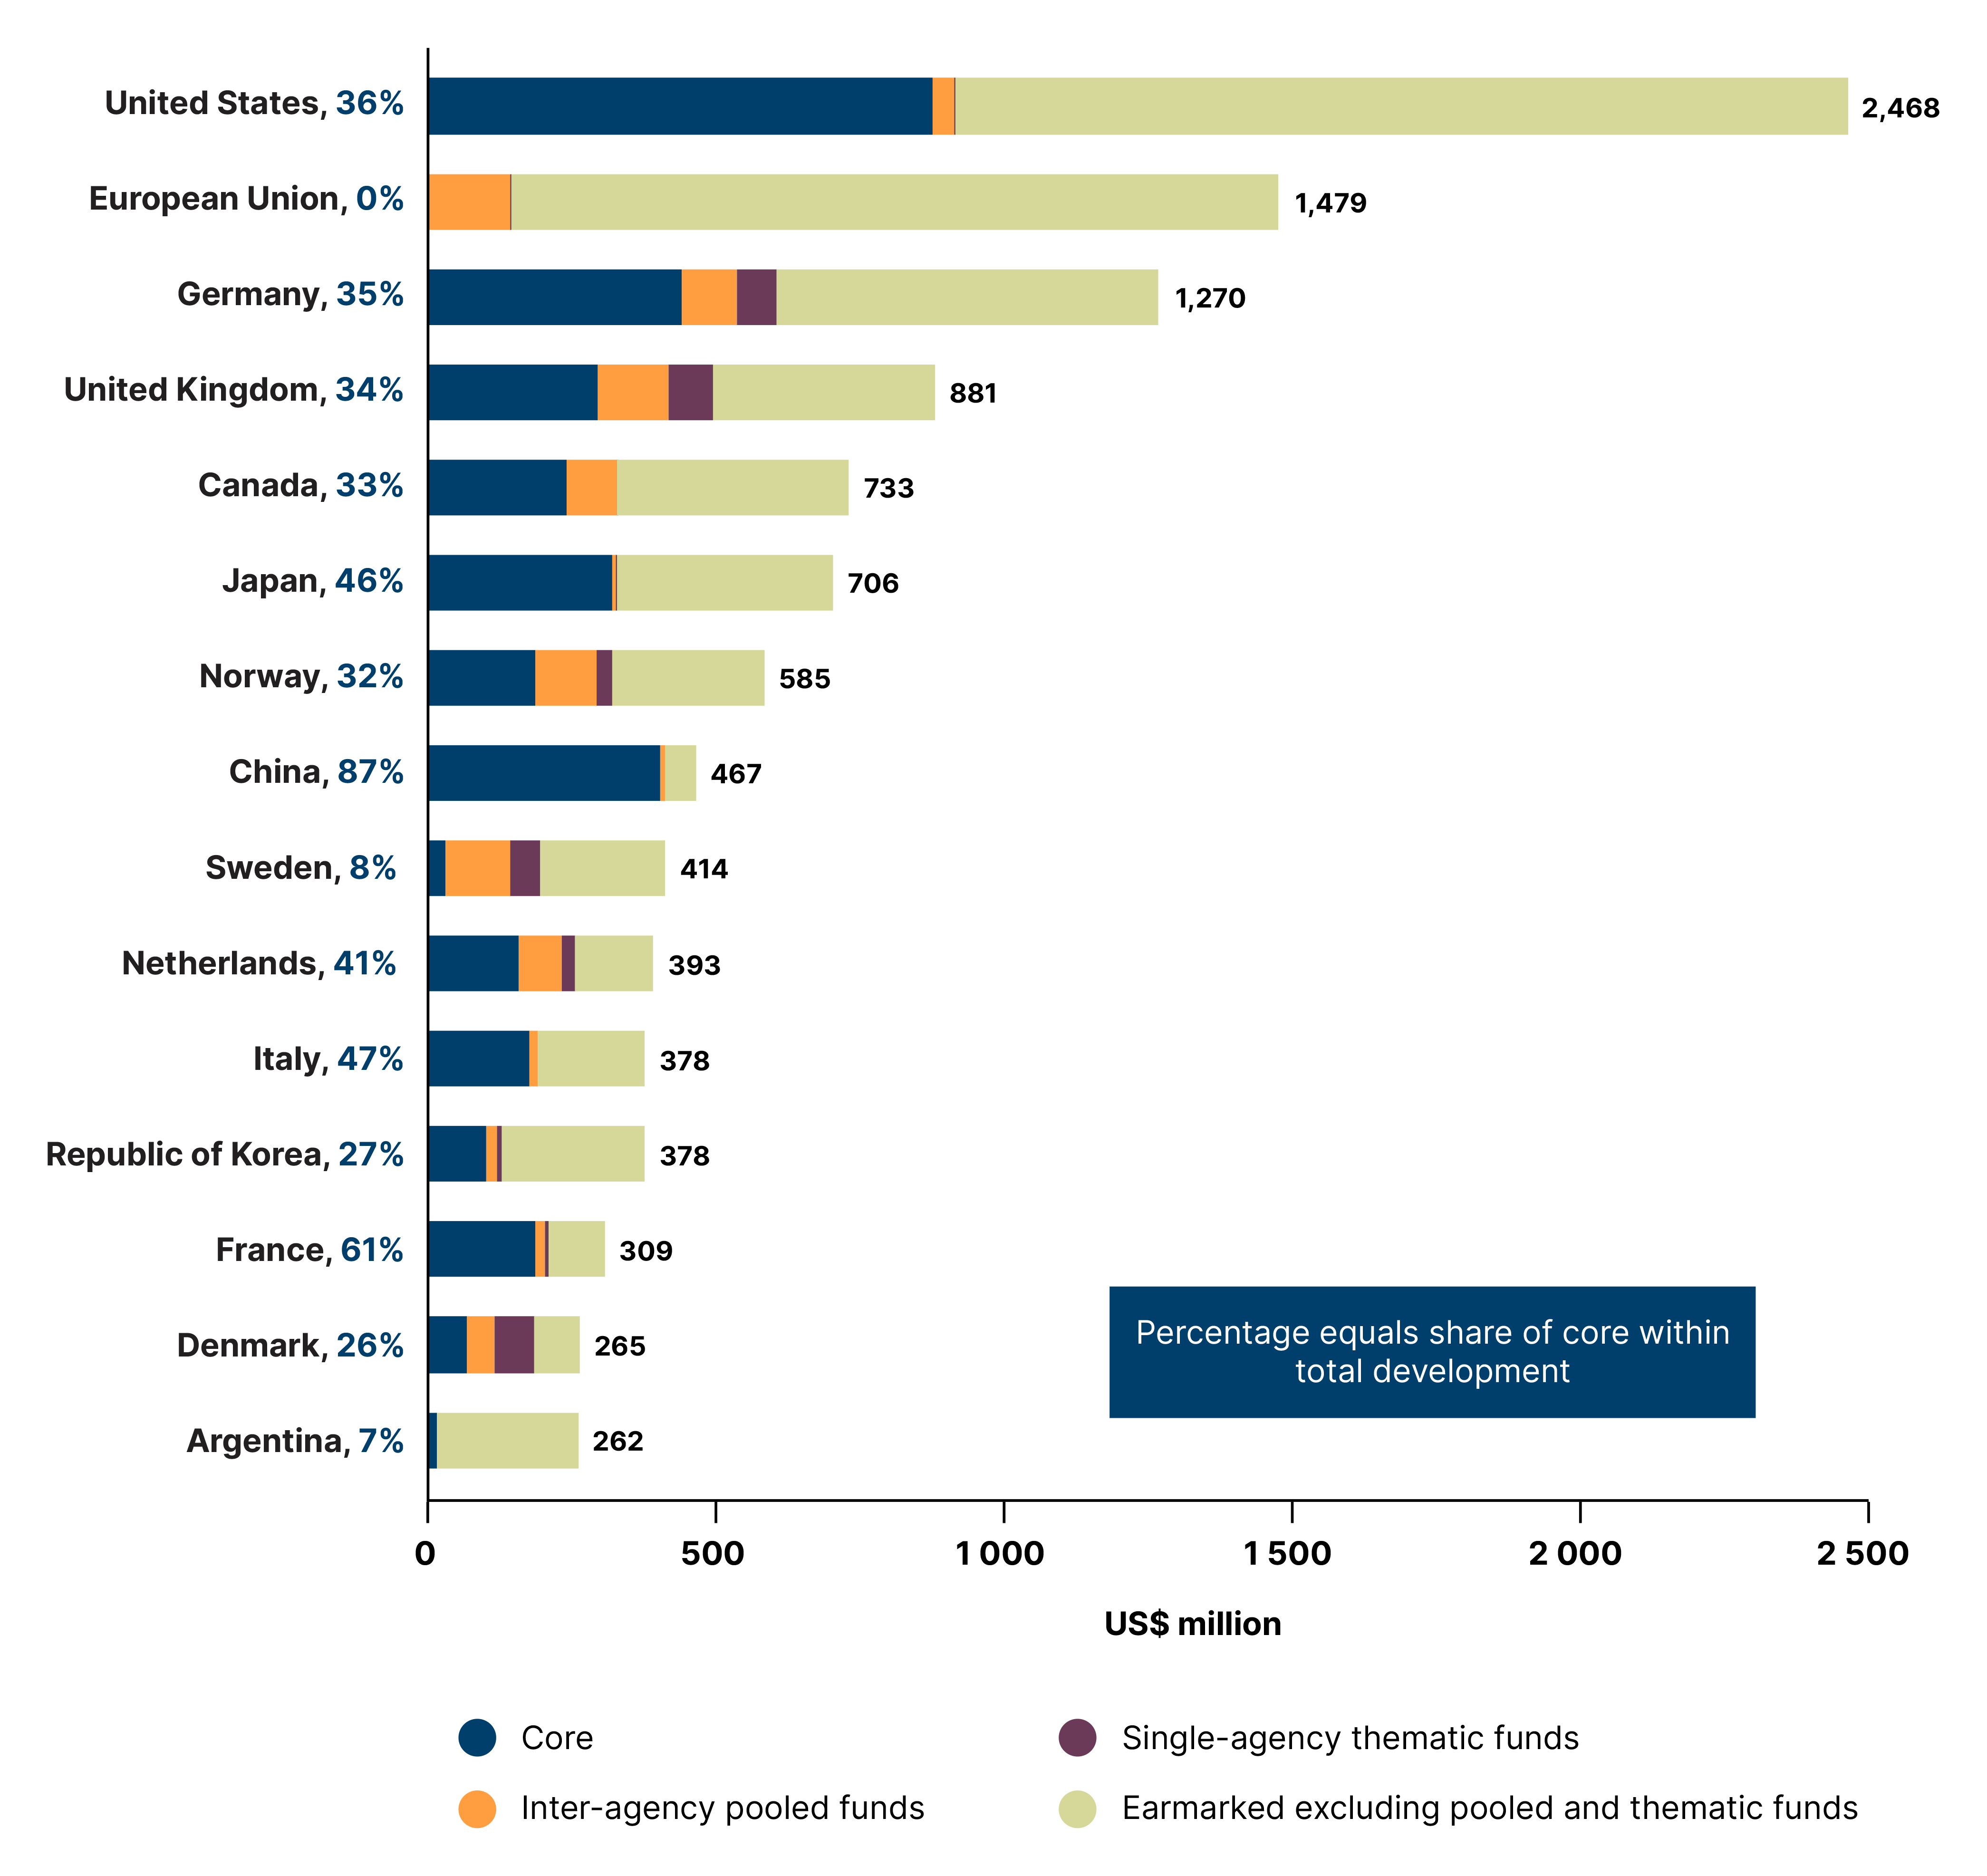
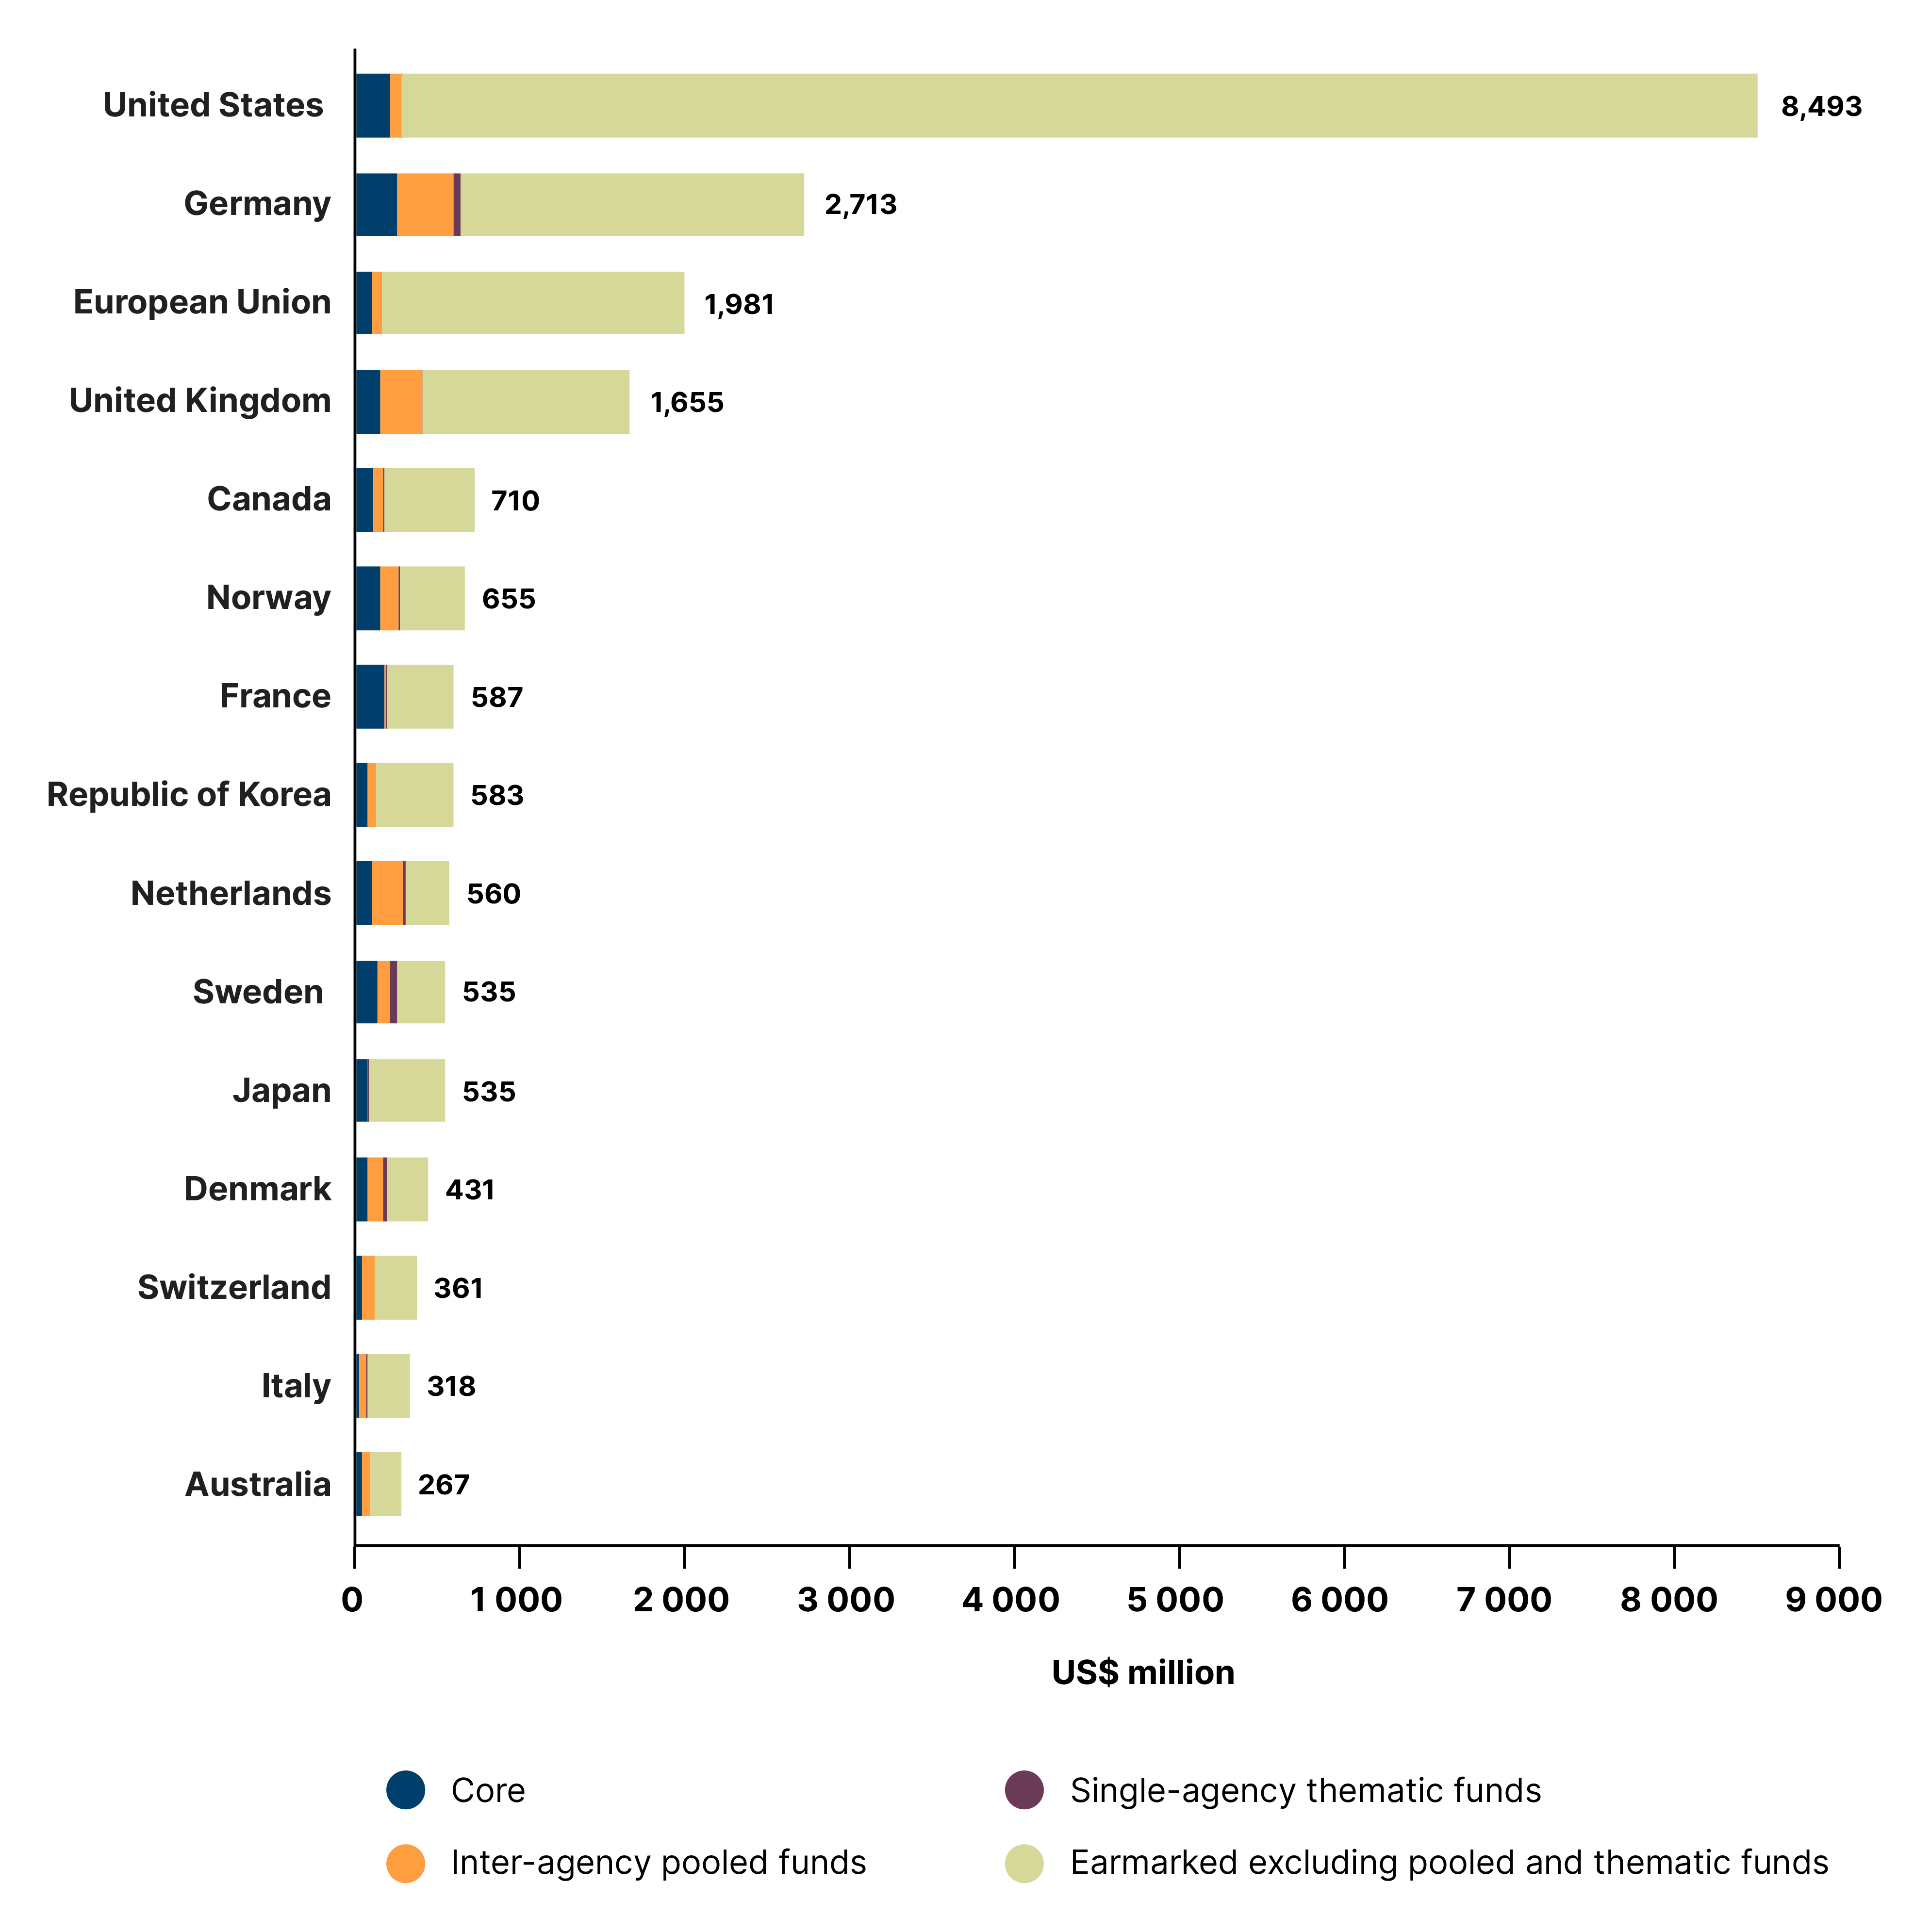
Figures 18 and 19 show the 2024 composition of the top 15 contributors (UN Member States and the EU) to, respectively, development and humanitarian assistance. While the distribution of funding modalities varies between the two, both reveal a high concentration of contributions among a limited number of donors.
The top five contributors to development assistance in 2024 – the United States, the EU, Germany, the United Kingdom and Canada – collectively accounted for 37% of total contributions. Expanded to include Japan, Norway, China, Sweden and the Netherlands, the top ten donors together provided half of total development assistance. Most of these featured contributors provide the bulk of their development assistance as earmarked funding. The EU, Germany, the United Kingdom, Canada, Norway, Sweden and the Netherlands make notable use of UN inter-agency pooled funds.
Funding composition for UN development assistance: Top Member State contributors and the EU, 2024 (US$ million)
Source: Report of the Secretary-General (A/81/75/Add.1-E/2026/61/Add.1) and UN Pooled Funds Database.
The revitalised funding compact sets clear targets for rebalancing voluntary non-core, or earmarked, funding by 2027. Key objectives include increasing the share of Member State contributions to single-agency thematic funds to 15% and raising the share of Member State ear marked contributions for development activities channelled through UN inter-agency pooled funds to 30%. Moreover, annual financial targets have been put in place to ensure key pooled funding instruments can deliver timely, rapid, predictable support: US$ 500 million each for the Joint SDG Fund and the Peacebuilding Fund (PBF), and US$ 800 million for country-level multi-partner trust funds (MPTFs) supporting UN Sustainable Development Cooperation Frameworks (UNSDCFs).42 In 2024, funding for all three instruments remained well below the compact targets.
Funding composition for UN humanitarian assistance: Top Member State contributors and the EU, 2024 (US$ million)
Source: Report of the Secretary-General (A/81/75/Add.1-E/2026/61/Add.1) and UN Pooled Funds Database.
UNDS top contributors to humanitarian activities
The concentration of funding among relatively few contributors is even more pronounced on the humanitarian side, where the top 15 contributors – all OECD-DAC members – together accounted for 77% of funding, with the US alone providing 32%.
Figure 19 illustrates the funding composition of the top 15 contributors to humanitarian assistance channelled through the UNDS in 2024, disaggregated by funding modality. Across all 15 contributors, the share of core and single-agency thematic funding is minimal, highlighting a persistent gap in the availability of flexible, predictable funding for humanitarian operations. Still, nine of the contributors channelled more than 10% of their contributions through UN inter-agency pooled funds.
If OECD-DAC projections prove correct, humanitarian ODA from DAC countries declined by 35.8% to US$ 15.5 billion in 2025, with a reported reduction of more than 50% in such assistance from the United States.43 As these numbers imply, the UN’s heavy reliance on a narrow range of funding sources has led to a sharp contraction in resources for humanitarian action in 2025. This trend was already evident in Figure 6, which shows that the two largest humanitarian agencies, WFP and UNHCR, together experienced a decline in overall revenue of US$ 4.6 billion.