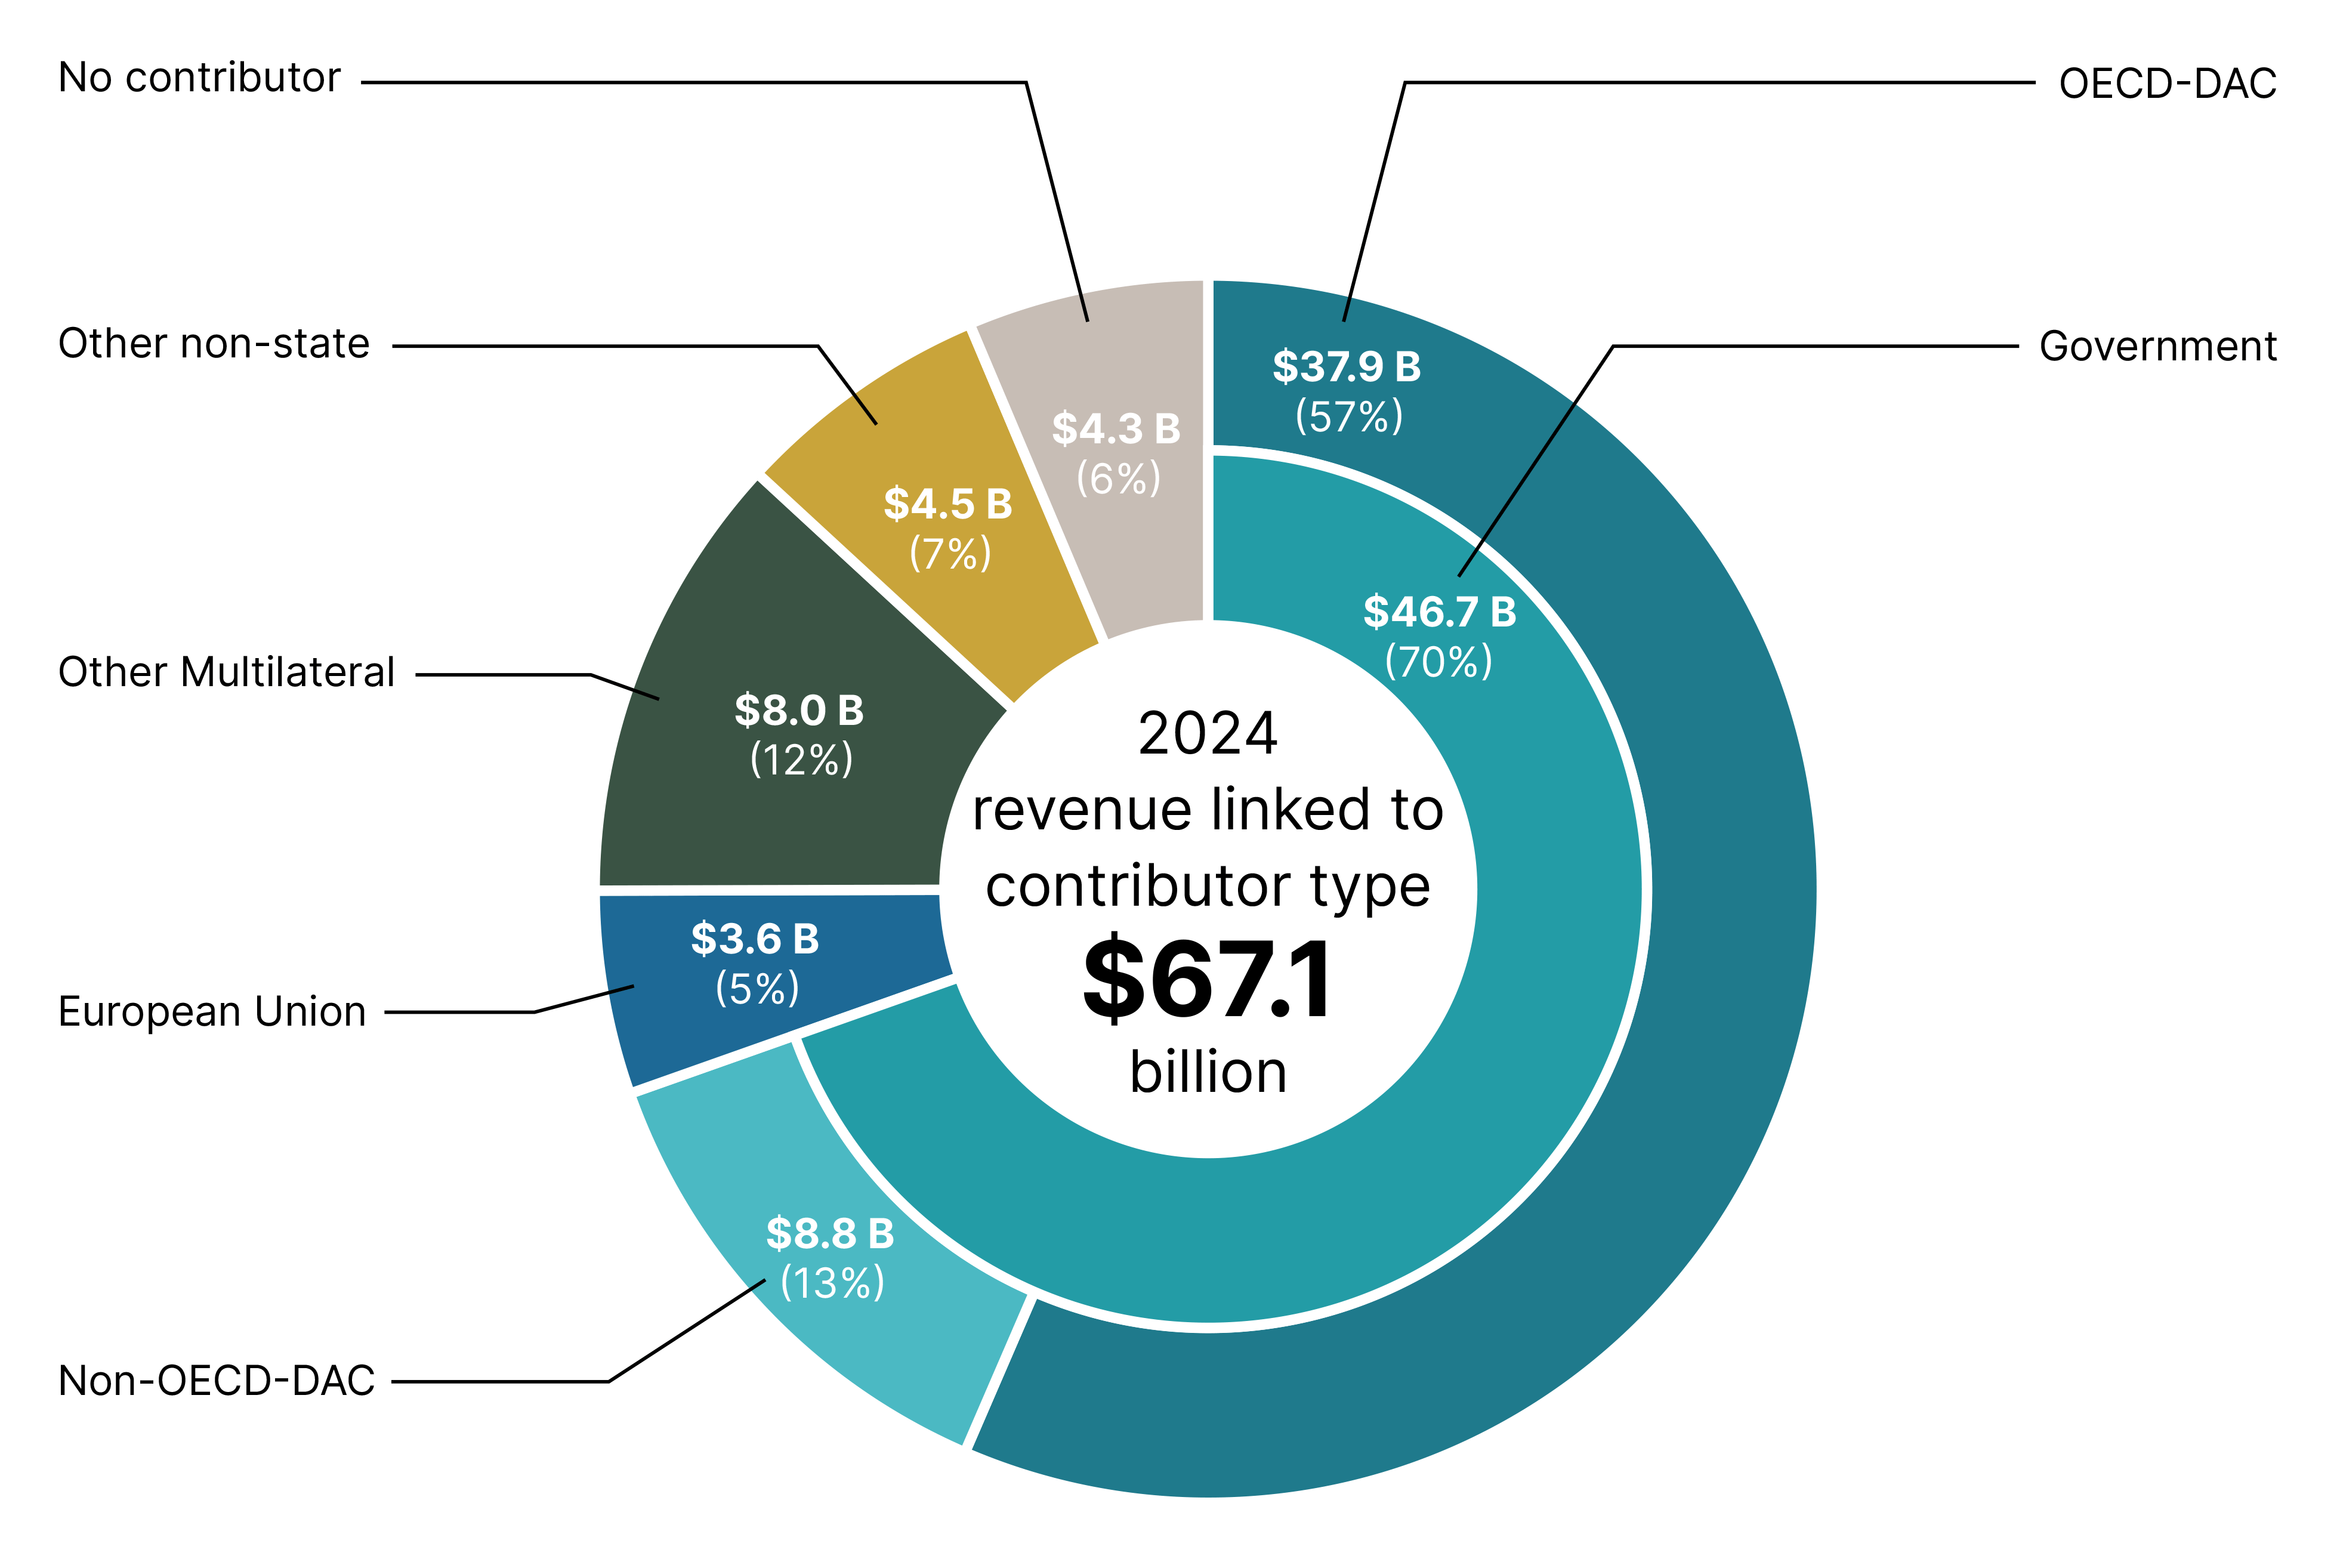
Having reviewed UN system funding by entity and financial instrument, we now turn to the sources of this funding. Figure 7 presents a breakdown of the UN system’s total revenue for 2024 (US$ 68.3 billion) by contributor type. The UN system is financed by a diverse range of partners, including governments; multilateral financing mechanisms and institutions; private sector entities; foundations; and non-governmental organisations (NGOs).
Governments remain the primary source of funding for the UN system. In 2024, including contributions from the EU, they accounted for three-quarters of UN system revenue, or US$ 50.3 billion. OECD-DAC members collectively contributed 62% of total revenue – 57% (US$ 37.9 billion) from 31 DAC governments and an additional 5% (US$ 3.6 billion) from the EU.26 Non-OECD-DAC member contributions accounted for 13% of the total, or US$ 8.8 billion. Other multi lateral funding channels, such as vertical funds and inter-agency pooled funds, are also largely government financed. These figures underscore the central role that governments play in financing the UN system (see Figure 7).
Funding sources for the UN system, 2024
Source: Chief Executives Board for Coordination (CEB).
Note: The total of US$ 67.1 billion is US$ 1.2 billion lower than the 2024 UN system revenue of US$ 68.3 billion, as revenue from the Pan American Health Organization (PAHO) was not disaggregated by contributor.
Revenue from Member States
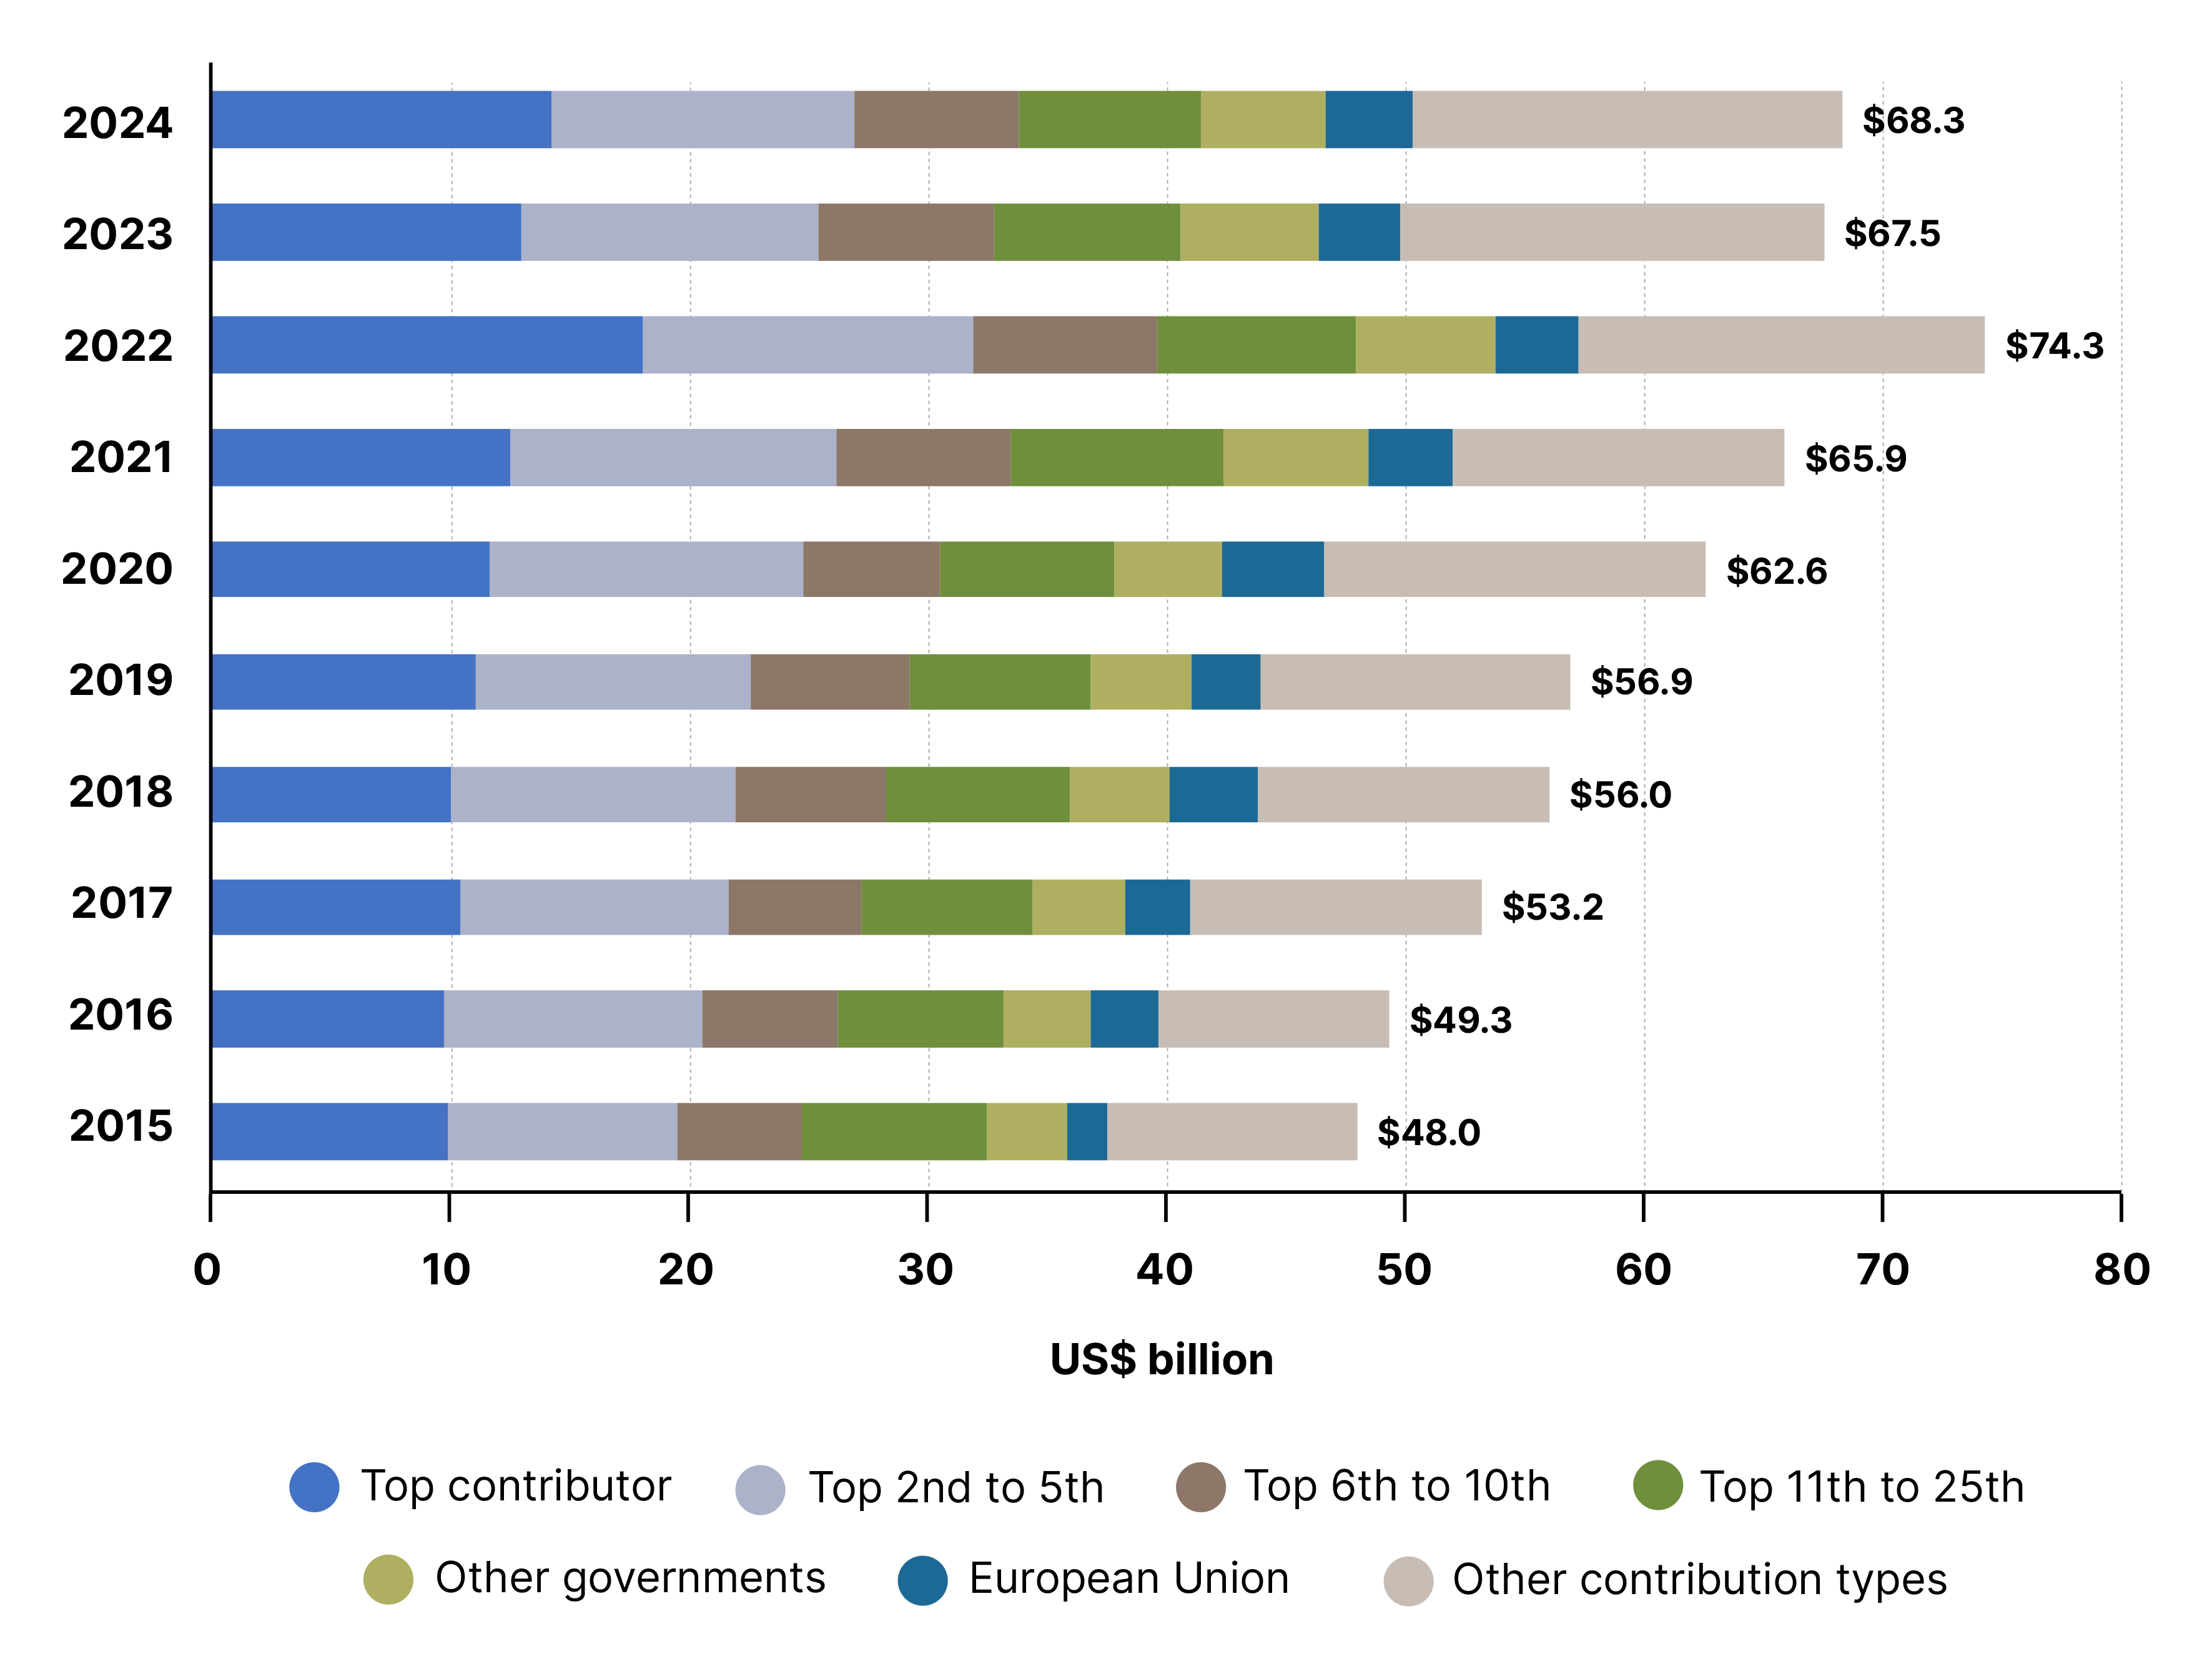
Figure 8 illustrates the composition and overall volume of UN system contributions from 2015 to 2024, disaggregated by tiers of government contributors, the EU, and other contributor types. In doing so, it highlights both the evolution of total funding and the distribution between contributor groups.
The top five contributors, represented by the two left-most segments within the horizontal bars in Figure 8, accounted for 58% of total government contributions in 2024 and nearly 40% of the UN system’s total annual revenue. Expanding this out to the top ten government contributor increases these figures to 72% of all government contributions and nearly half of total revenue. This concentration was consistent throughout the 2015–2024 period, underscoring the organisation’s continued reliance on a relatively small group of Member States.
The United States remained the top contributor to the UN system in 2024. Most of the other leading Member State contributors in 2024 have also been among the top contributors since 2015, the year that China – the only non-OECD- DAC country among them – emerged as part of the group. Given UN entities report revenue on an accrual basis, the timing of multi-year contribution commitments can affect annual rankings. As a result, some Member States may appear among the top ten contributors in the year the multi-year agreement is signed, before dropping outside the ranking in subsequent years. Such has been the case for the Netherlands and Sweden, among others (see Box 3 Chapter 3)
UN system funding by Member States and other contributors, 2015–2024 (US$ billion)
Source: Chief Executives Board for Coordination (CEB).
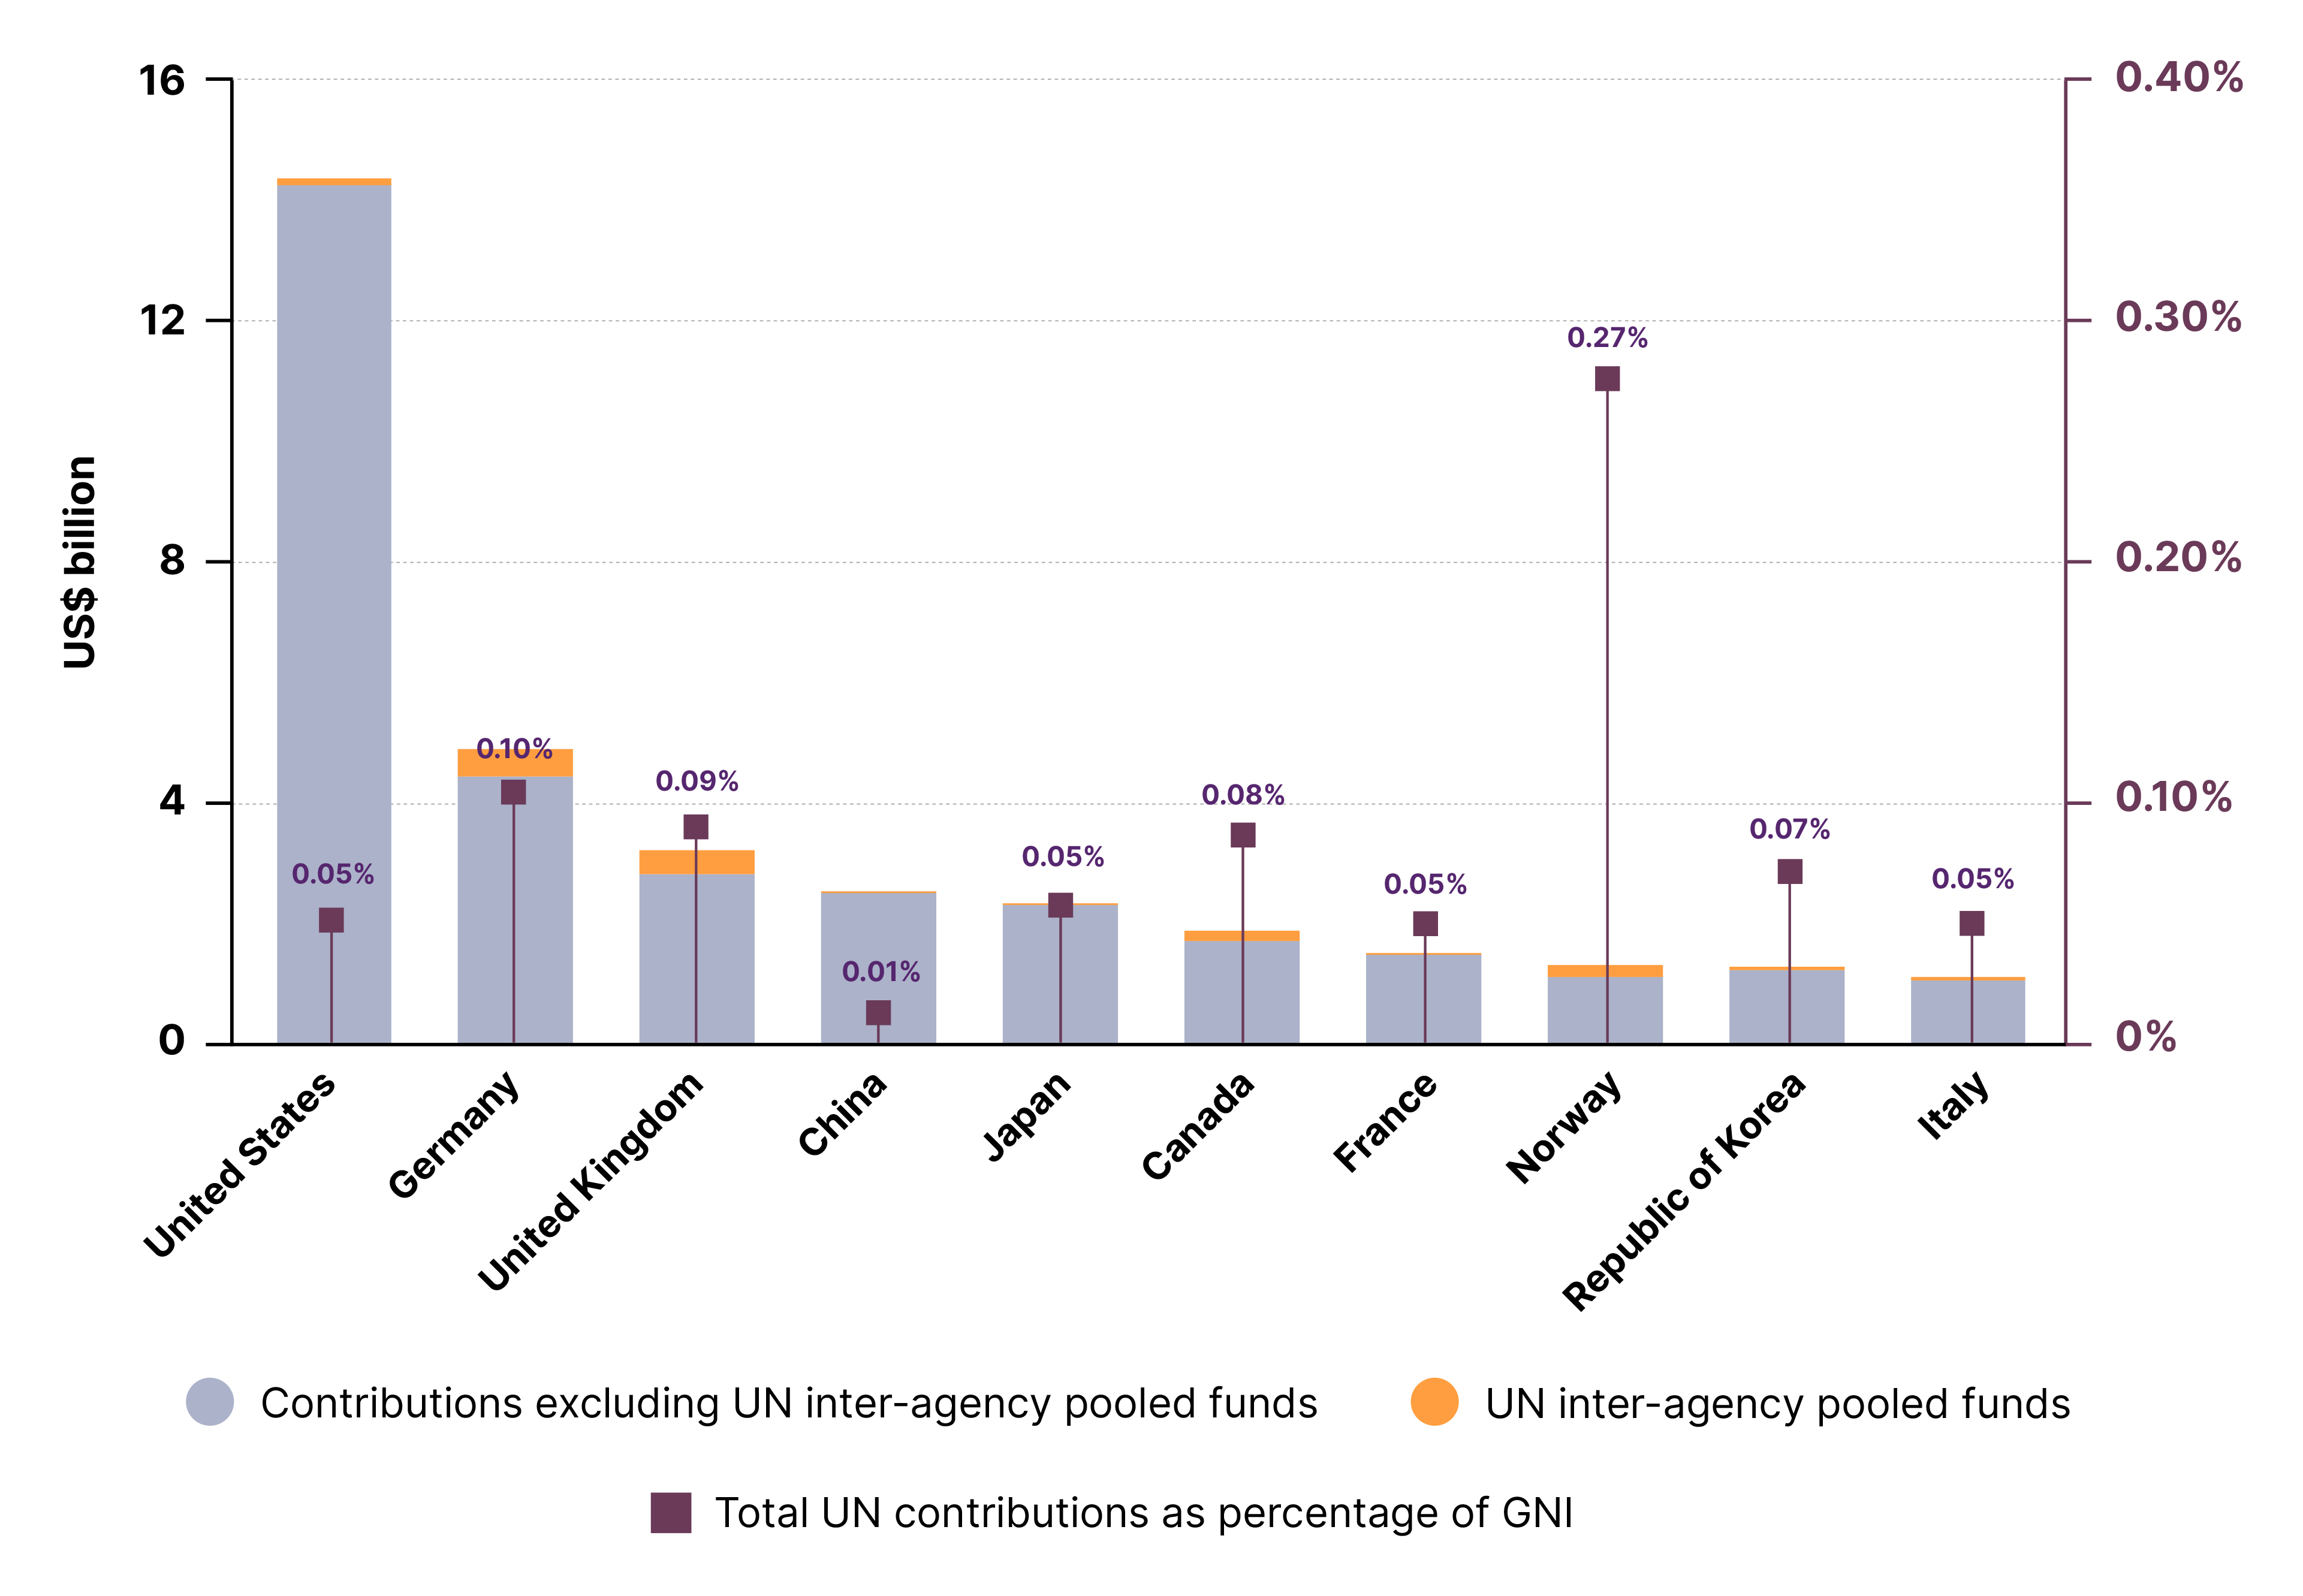
Figure 9 presents the top government contributors to the UN system in 2024, ranked by absolute contributions (in US$ billions) – encompassing contributions reported by UN entities to the CEB, as well as those provided via inter-agency pooled funds – and also contributions relative to each country’s gross national income (GNI). This dual perspective reveals not only the scale of financial support, but the proportional effort made by each Member State relative to their economic capacity.
In absolute terms, the United States was substantially ahead of all the other donors in 2024. When measured as a share of GNI, however, its contribution stands at 0.05% – a comparable level to Japan, France and Italy, but smaller than several other major donors. By contrast, Norway ranks as the eighth-largest contributor to the UN system in absolute terms, but at 0.27% leads the way when it comes to share of GNI. Notably, although Denmark and Sweden were not among the top ten contributors in 2024, their contributions as share of GNI are among the highest, with 0.19% and 0.17% respectively.
Germany, Japan and the United Kingdom have consistently ranked among the top five contributors to the UN system in absolute terms during the 2015–2024 period. Having held the second-place position since 2016, Germany contributed US$ 4.9 billion (including contributions to UN inter-agency pooled funds) in 2024, or 0.10% of its GNI. Meanwhile, the United Kingdom’s 2024 contribution stood at US$ 3.2 billion, or 0.09% of its GNI.
Top Member State contributors to the UN system, 2024 (US$ billion and percentage share of GNI)
Source: Chief Executives Board for Coordination (CEB) , UN Pooled Funds Database, and UN Statistics Division (UNSD).
Returning to Figure 8, contributions from the top 11th to 25th donors, along with the segment representing ‘other governments’, have fluctuated year on year. Combined, they increased from US$ 11.1 billion in 2015 to US$ 12.9 billion in 2024 – respectively, 23% and 19% of total UN system revenue. This points to the ongoing engagement of a broad range of Member State contributors in the UN’s work, and to the declining share of their contributions in total UN revenue.
Revenue provided by non-Member State contributors and other contributor types nearly doubled over the same period, rising from US$ 12.1 billion in 2015 to US$ 21.6 billion in 2024.27 Within this group, the EU increased its contributions from US$ 1.7 billion in 2015 to $3.6 billion in 2024. While the EU is not a UN Member State, it holds enhanced observer status at the UN General Assembly and is a critical partner when it comes to achieving the UN system’s global mandates. EU contributions to the UN Secretariat and various UN agencies are examined in further detail below.
Revenue from multilateral channels
The UN system is also funded by a diverse set of multi-lateral institutions and funding mechanisms, which are themselves largely supported by governments. The EU is funded entirely by its member states, while IFIs such as the World Bank draw resources from a combination of member contributions, bond issuances and borrowing arrangements. In 2024, governments accounted for 90% of contributions to UN inter-agency pooled funds, another key multilateral financing channel.
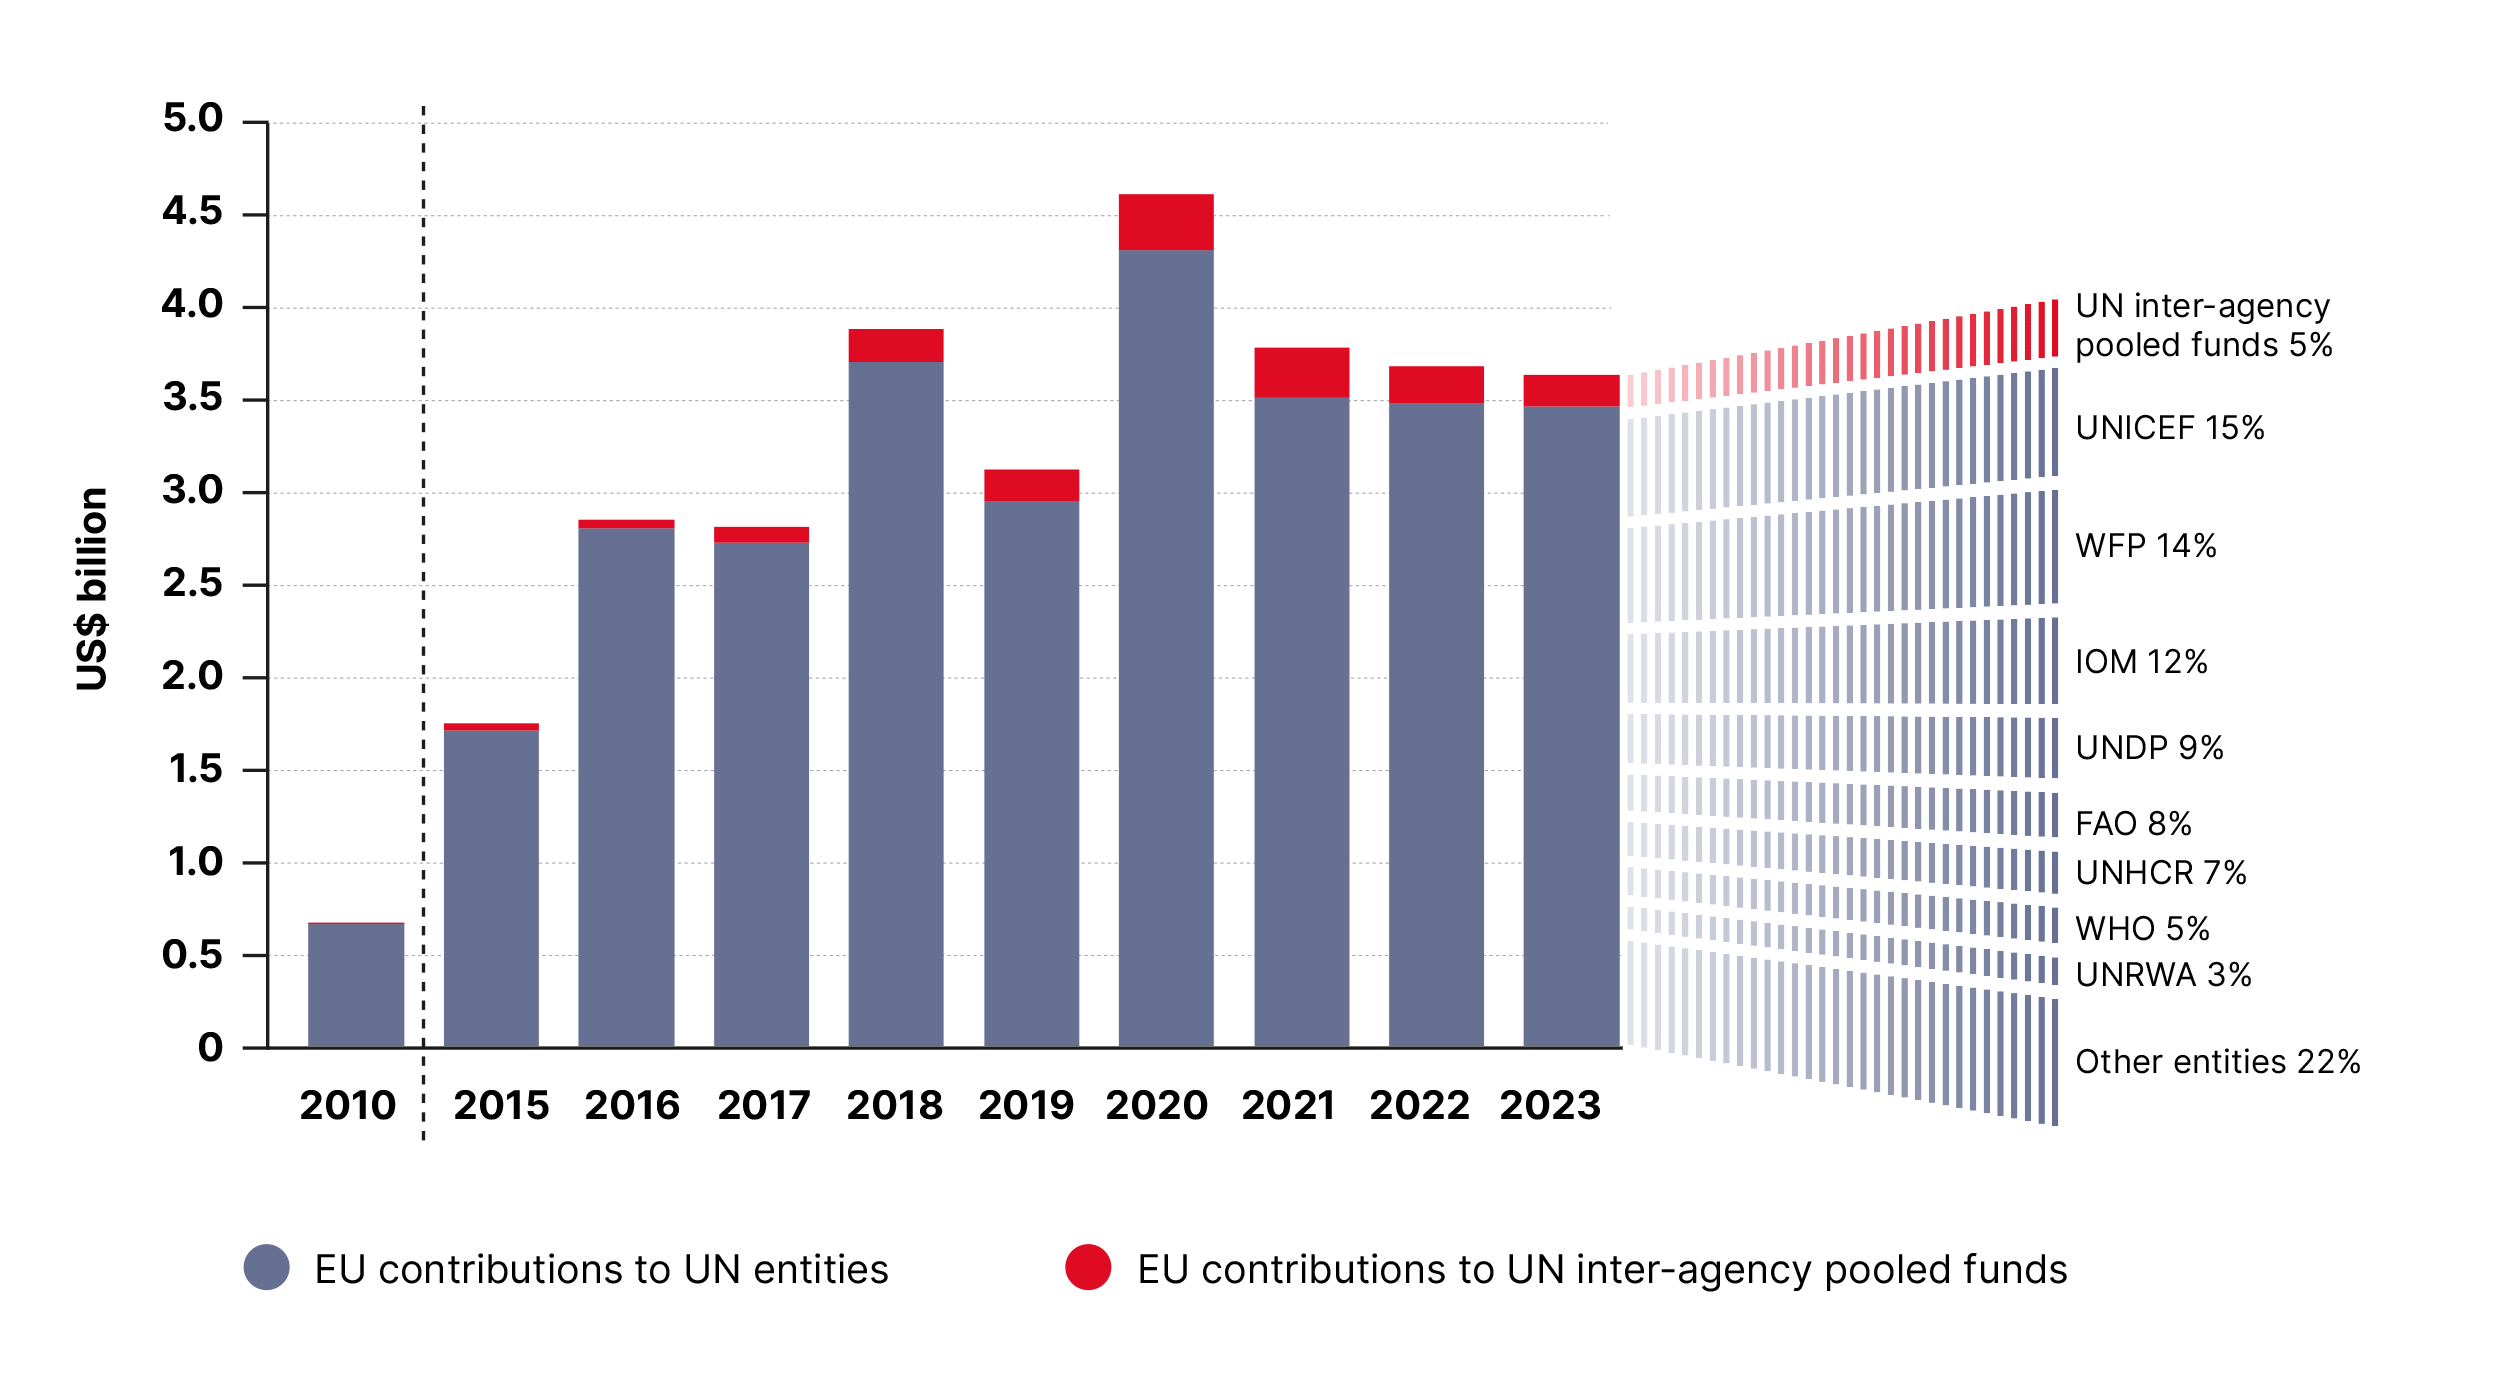
The EU is a key partner for both the UN system and UN inter-agency pooled funds. Figure 10 illustrates EU funding levels to the UN system for the 2015–2024 period, with a side panel showing the distribution of 2024 funding across the main UN entity recipients. As a political and economic union of member states, the EU does not typically provide assessed or voluntary core contributions. Nevertheless, its (mainly earmarked) contributions have more than doubled since 2015. Since hitting a peak of US$ 4.6 billion in 2020 due to the global needs arising from the COVID-19 pandemic, EU contributions have remained largely stable at around US$ 3.6–3.8 billion per year. This reflects the sustained engagement woven into the EU’s multi-year budget framework, which runs through 2027.
EU funding to the UN is almost entirely allocated to humanitarian and development assistance, reflected in the fact that UNICEF, WFP and IOM together received 47% of total EU funding in 2024. The EU is also a key funding partner for UN inter-agency pooled funds, providing US$ 198 million in 2024 – 5% of the EU’s total contributions to the UN system.
Global vertical funds represent another major source of multilateral funding to the UN system. Although these funds are not administered by UN entities and the UN does not play a lead role in fund allocation decisions, UN entities do receive resources as implementing partners. In 2024, the UN system received US$ 2.7 billion via global vertical funds. UNDP, UNICEF and the United Nations Environmental Programme (UNEP) – the channel’s largest recipients – accounted for 73% of this total, receiving US$ 943 million, US$ 740 million and US$ 318 million respectively.
IFIs are critical partners when it comes to the large-scale financing of national development efforts, and in doing so provide a further multilateral financing channel for the UN system. Key institutions include the World Bank Group, the International Monetary Fund (IMF), and regional development banks such as the African Development Bank (AfDB), Asian Development Bank (ADB) and Inter-American Development Bank (IDB). Direct financial flows from IFIs to the UN system amounted to US$ 2.2 billion in 2024, or 3.3% of total revenue. This figure does not, however, capture the full extent of collaboration between IFIs and UN entities, which often involves other forms of partnerships aimed at catalysing resources for SDG achievement. For example, UNICEF worked with the World Bank Group’s International Development Association (IDA) – tasked with helping the 75 poorest countries – during its 21st replenishment cycle in order to ensure children’s needs were prioritised in fund allocations.28
EU funding to the UN system, 2010–2023 (US$ billion)
Source: Chief Executives Board for Coordination (CEB) and UN Pooled Funds Database.
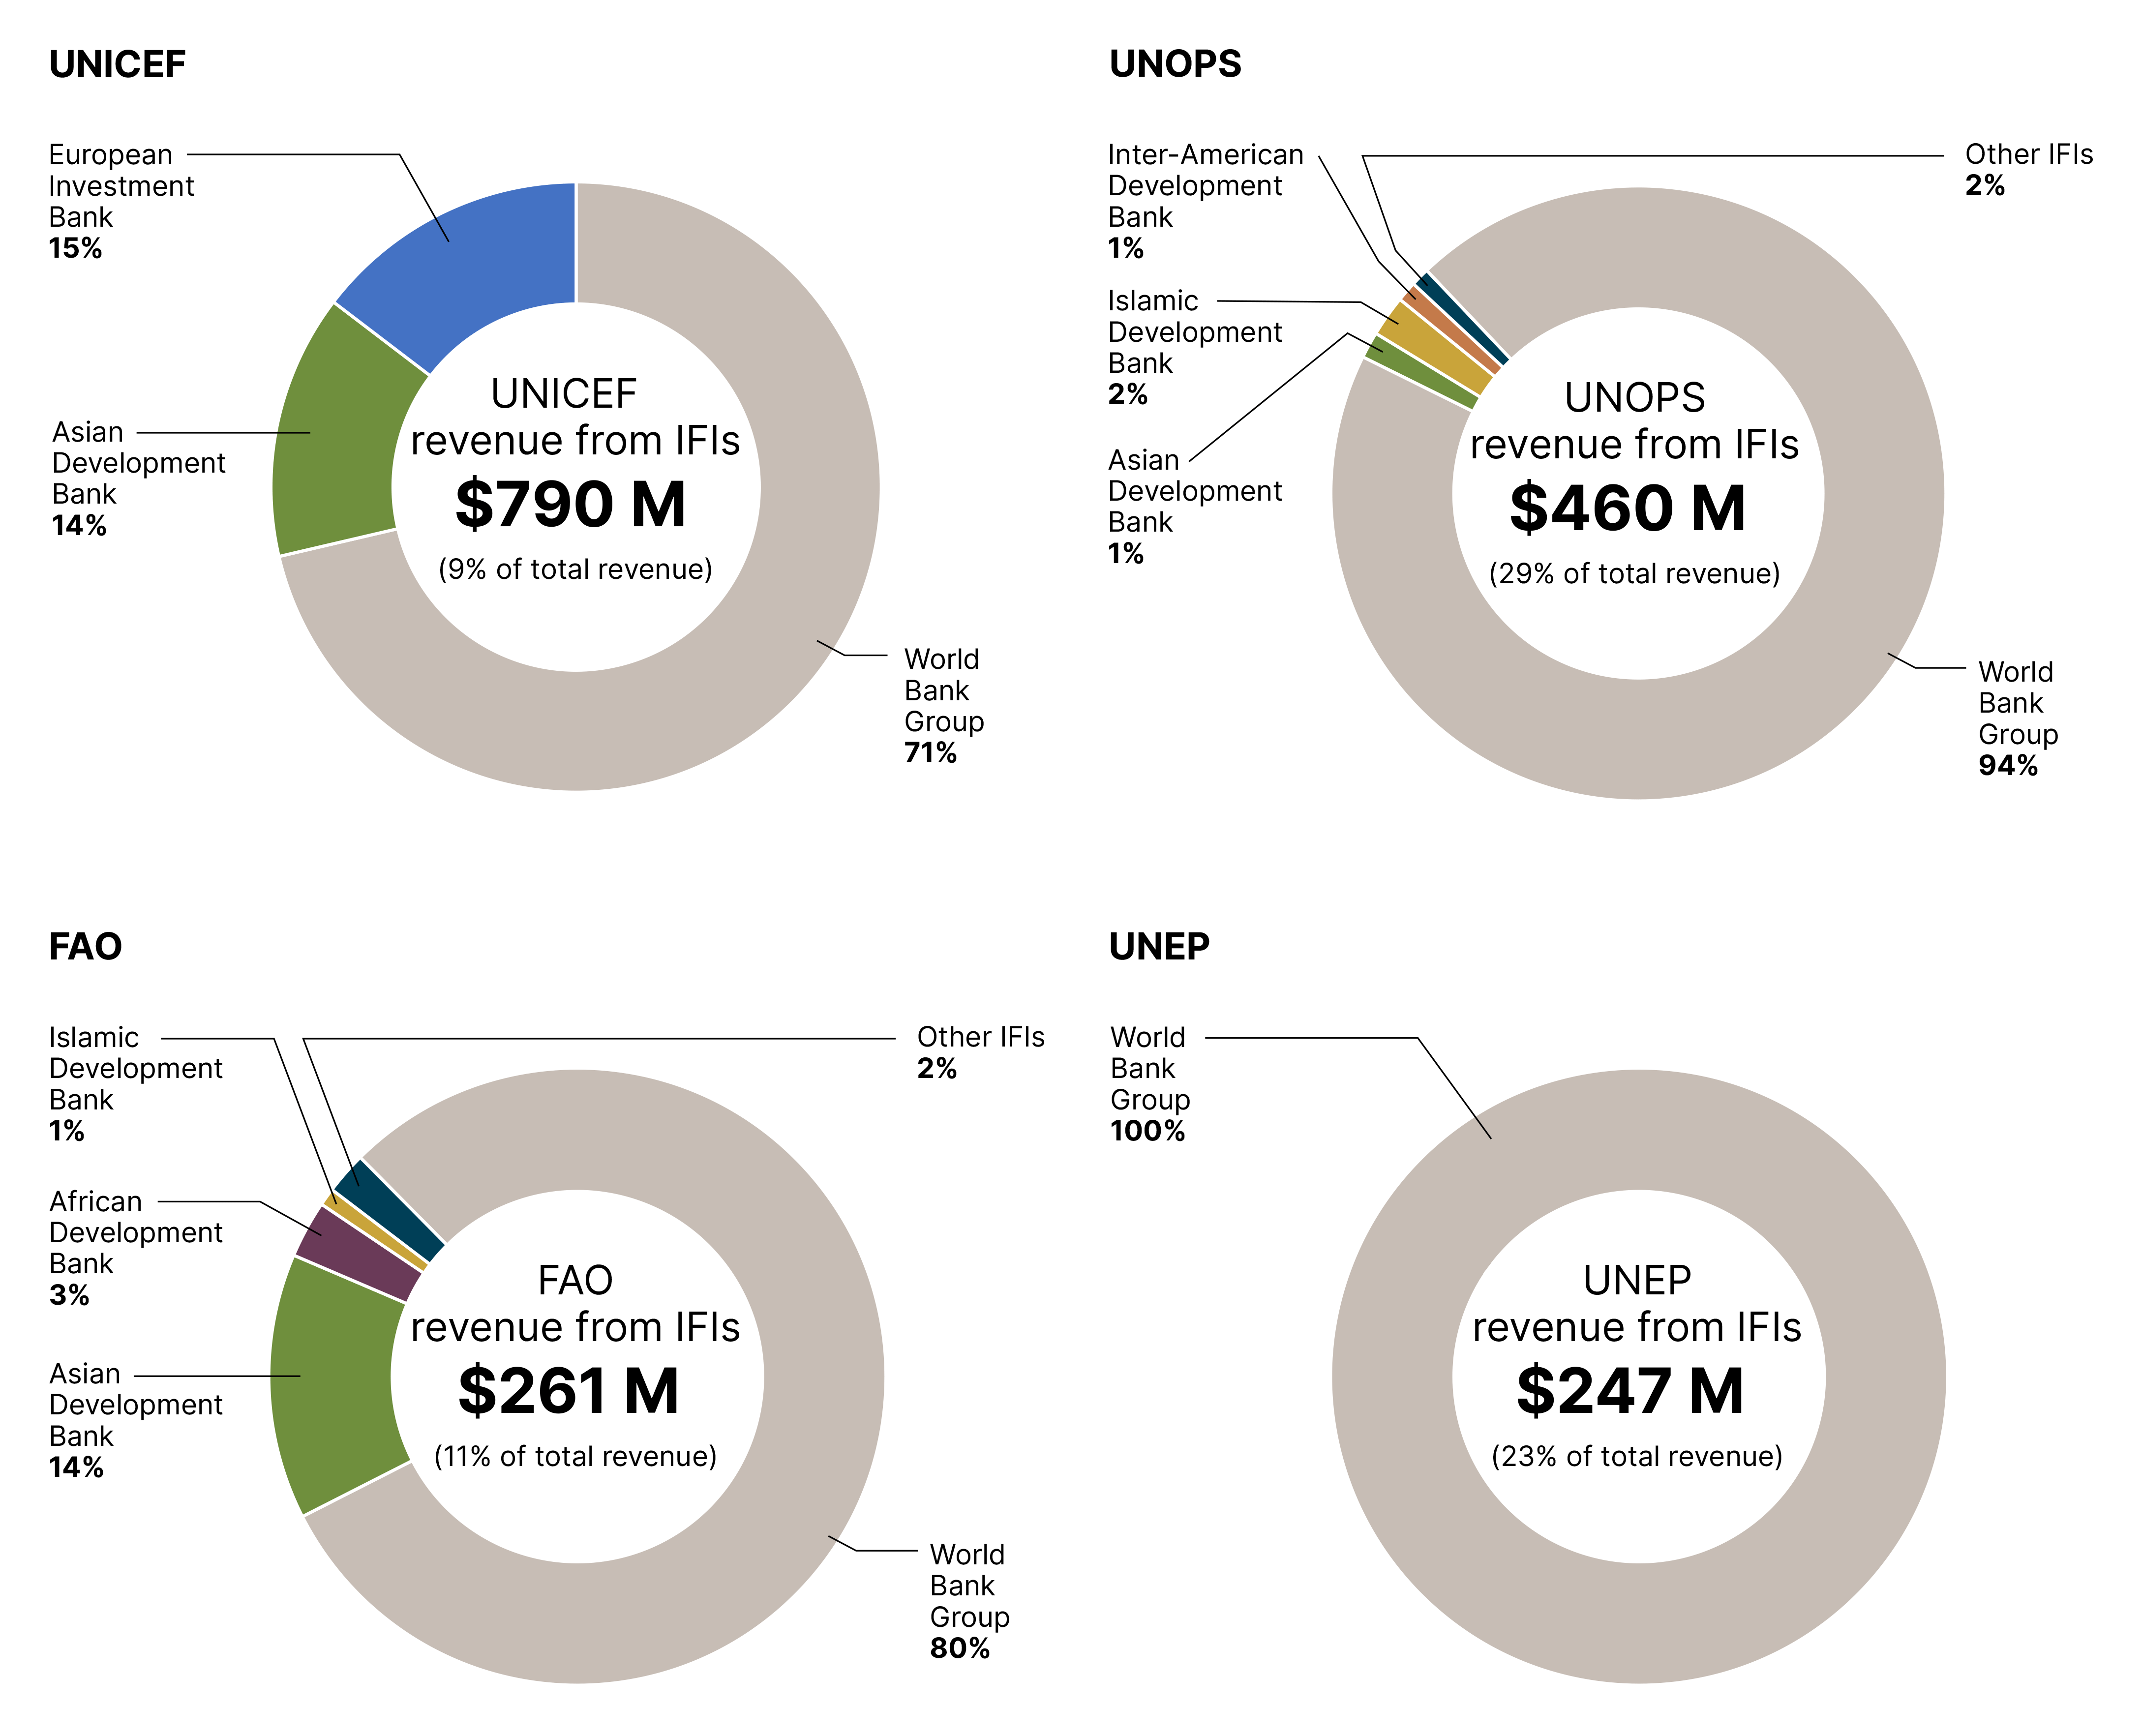
Figure 11 illustrates funding received from IFIs in 2024, by a selection of UN entities where such revenue plays a significant role. Overall, the World Bank Group is by some distance the main partner, alongside several regional development banks. UNICEF is the biggest recipient of 2024 revenue ascribable to IFI funding, having received US$ 790 million (9% of its total revenue). In addition, UNICEF mobilised US$ 564 million from the World Bank Group to support countries facing emergencies such as conflicts, natural disasters or fragile conditions. This represents the largest IFI contribution to the UN system in 2024.
UNOPS actively engages with a wide variety of IFIs, including both global and regional multilateral development banks. In 2024, this translated into contributions of US$ 460 million (or 29% of UNOPS’s annual revenue), of which 94% came from the World Bank Group – linked to the latter’s increased demand for support in settings affected by conflict and fragility.29
A similar pattern can be seen in the cases of the Food and Agriculture Organization of the United Nations (FAO) and UNEP, which respectively received US$ 261 and US$ 247 million in IFI contributions in 2024, almost all of which came from the World Bank Group.30
In terms of volume of resources, the most prominent funding partnership between a regional development bank and a UN entity in 2024 was between the European Investment Bank (EIB) and UNICEF (US$ 116 million). The EIB focuses on projects that align with EU and partner country priorities. The partnership between the two organisations includes investing in quality education and skills training for vulnerable children; as well as implementing the Global Polio Eradication Initiative.31 The latter initiative seeks to eradicate the disease and strengthen health systems, especially in fragile and conflict-affected areas.
International Financial Institutions (IFIs) funding to select UN entities, 2024 (US$ million)
Source: Chief Executives Board for Coordination (CEB).
Revenue from other non-state funding
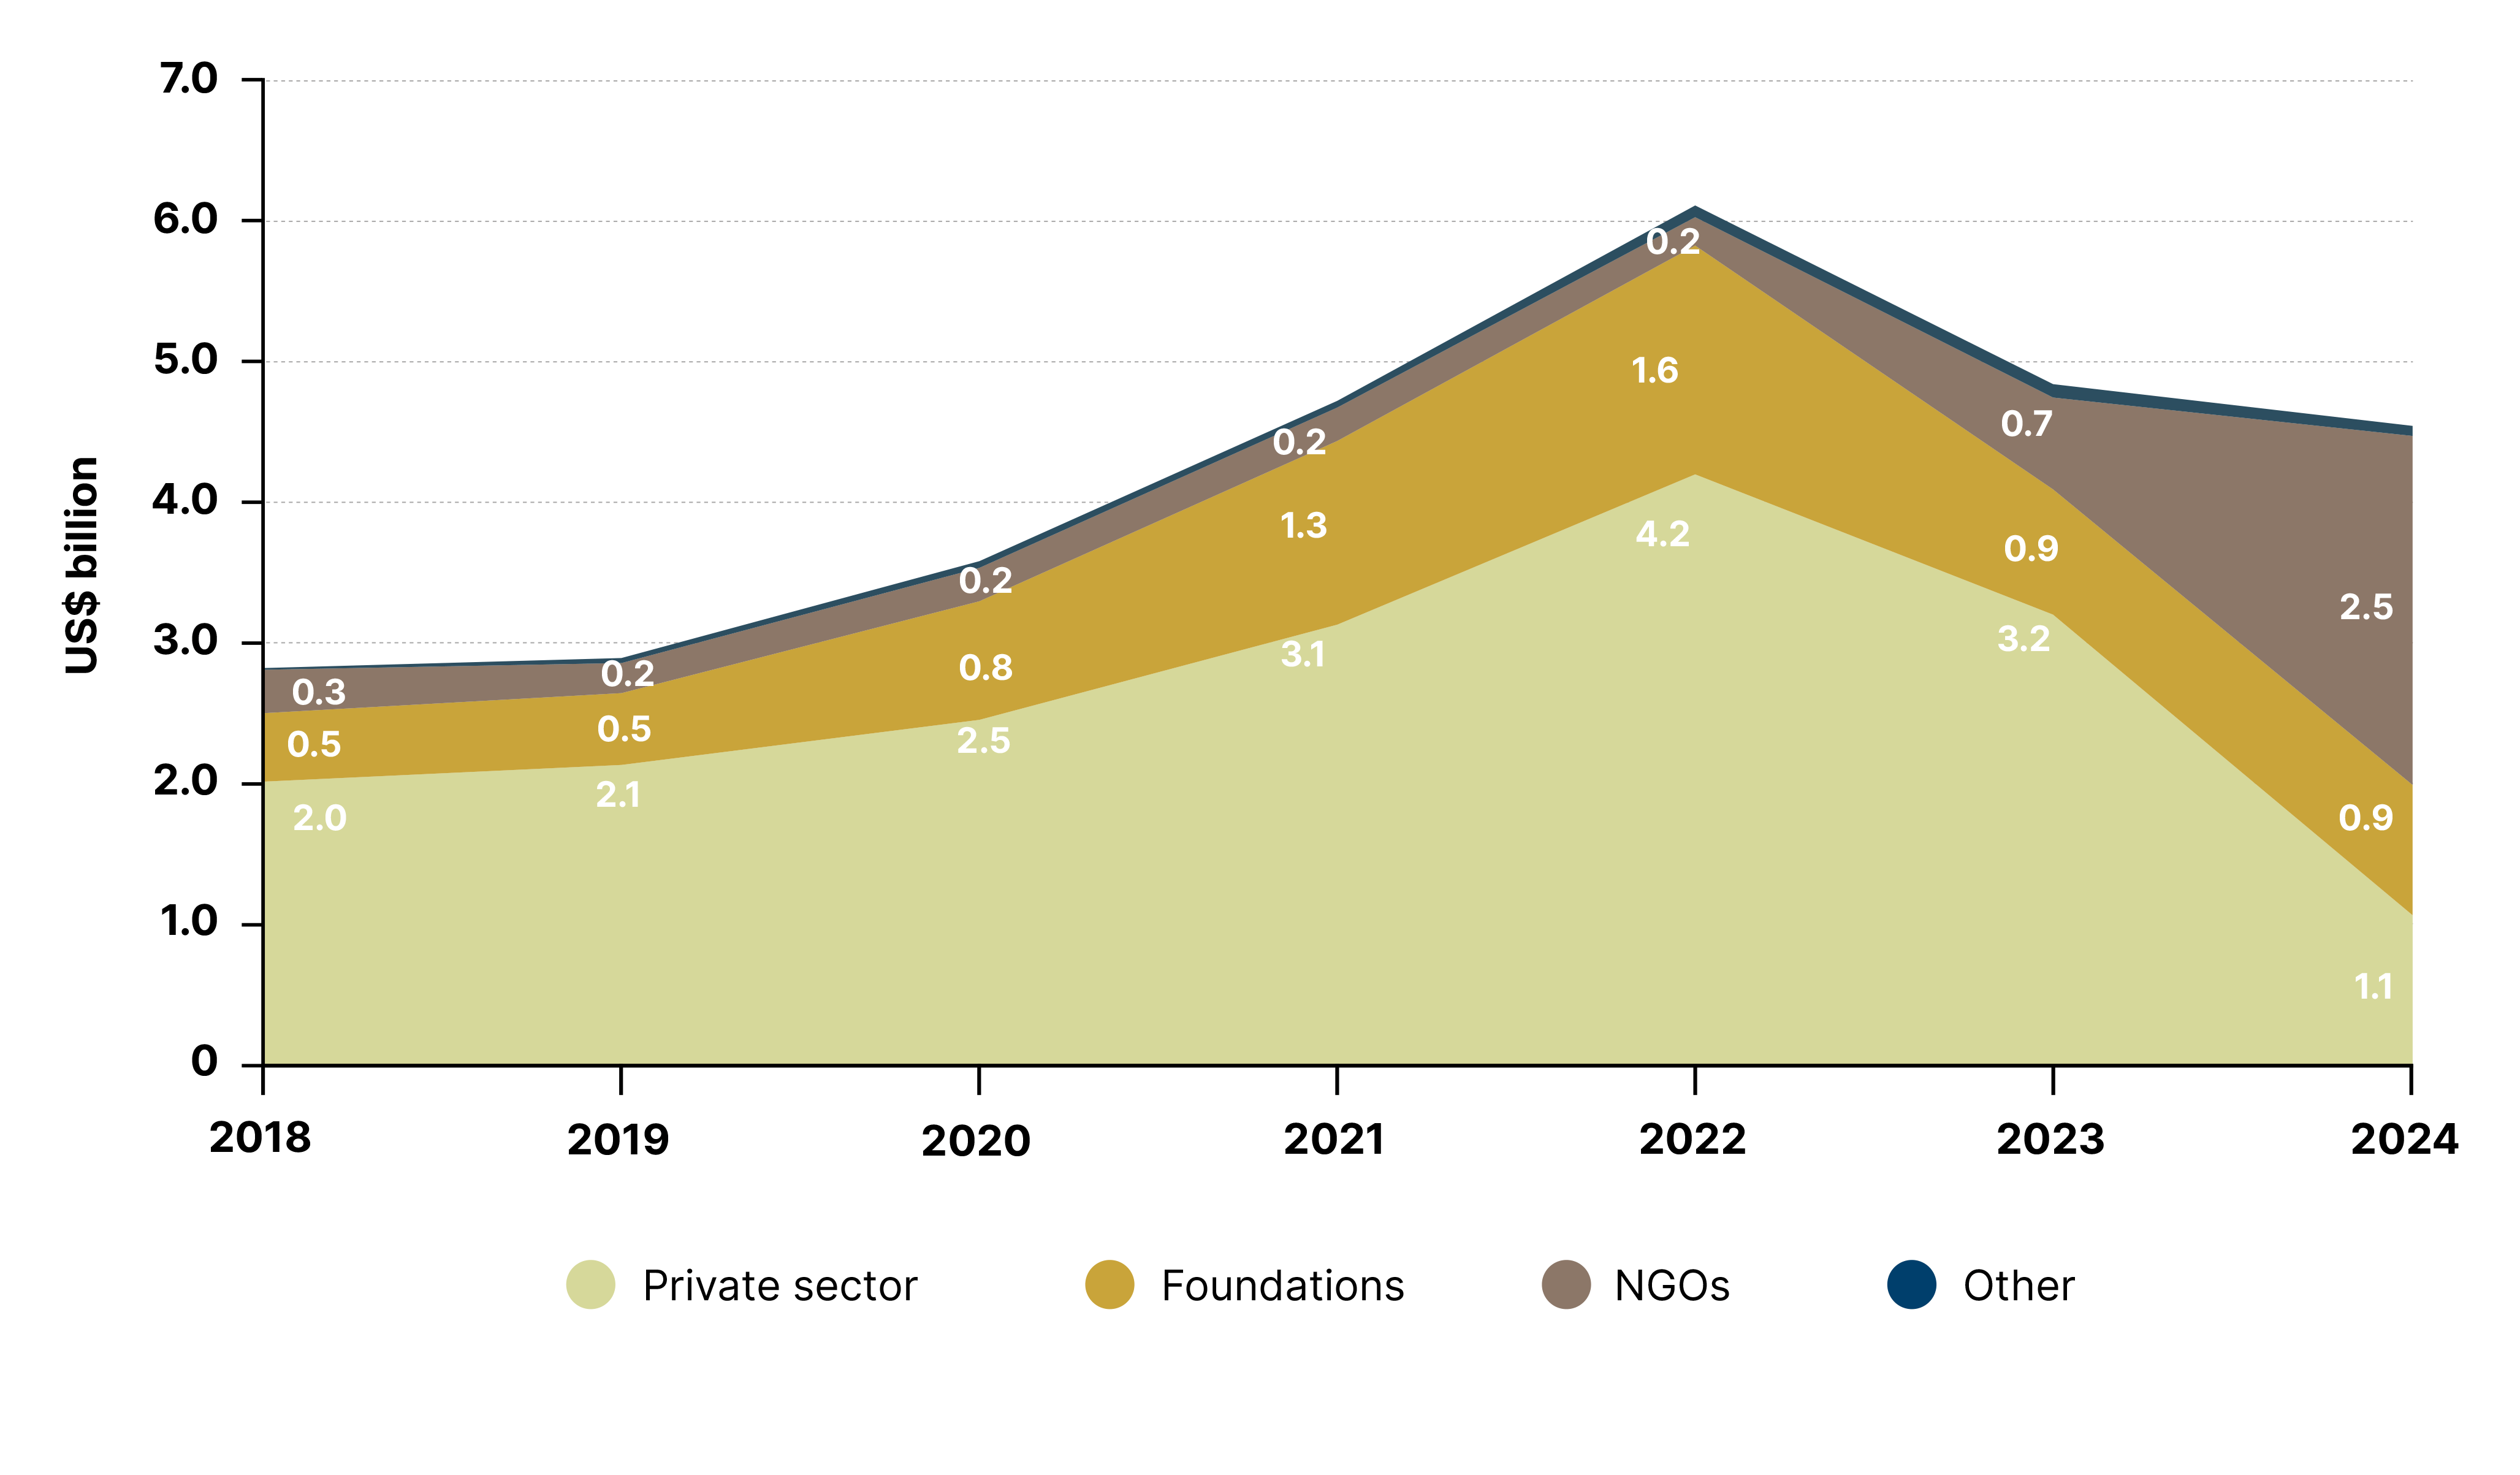
Partnership arrangements between the UN system and other non-state sources have gained increasing recognition as an important financing mechanism in the context of the 2030 Agenda for Sustainable Development. Figure 12 presents trends in contributions from non-governmental sources – namely the private sector, foundations, NGOs and other sources – over the period 2018–2024. Total contributions increased steadily from US$ 2.8 billion in 2018 (5% of total UN system revenue) to a peak of US$ 6.1 billion in 2022. This upward trajectory was followed by a decline, with total contributions falling to roughly US$ 4.5 billion by 2024 (7% of total UN system revenue).
From 2015 to 2023, the private sector consistently accounted for the largest share of other non-state contributions, partly because UNICEF classified revenue from its National Committees under this sub-category. UNICEF revised this approach for the 2024 reporting cycle, however, determining instead that these revenues should be reported as NGO contributions.32 As a result, NGO contributions increased significantly in 2024, at US$ 2.5 billion becoming the largest source among other non-state sources. This followed a similar reclassification by UNHCR, which, having previously reported revenue from its National Committees under foundations, reclassified these contributions as NGO funding from 2023 onwards.
Foundations contributed US$ 0.9 billion to the UN system in 2024. The Bill & Melinda Gates Foundation remained the largest such contributor, providing approximately US$ 0.5 billion.33
Other non-state funding to the UN system, 2018–2024 (US$ billion)
Source: Chief Executives Board for Coordination (CEB).
Note: Funding from public-private partnerships and from academic, training and research institutions is included under the category ‘Other’.
Revenue from no contributor
The ‘no contributor’ category is used in UN system-wide financial reporting when a revenue flow cannot be attributed to a specific external source or funding partner. In practice, this category serves as a technical reporting classification rather than a true funding source. Funding attributed to no contributor rose from US$ 3.9 billion in 2023 to US$ 4.3 billion in 2024, representing 6% of the UN system’s total revenue in both years. Revenues such as investment income, exchange rate gains or actuarial adjustments that do not originate from a donor are reported under this contributor type.