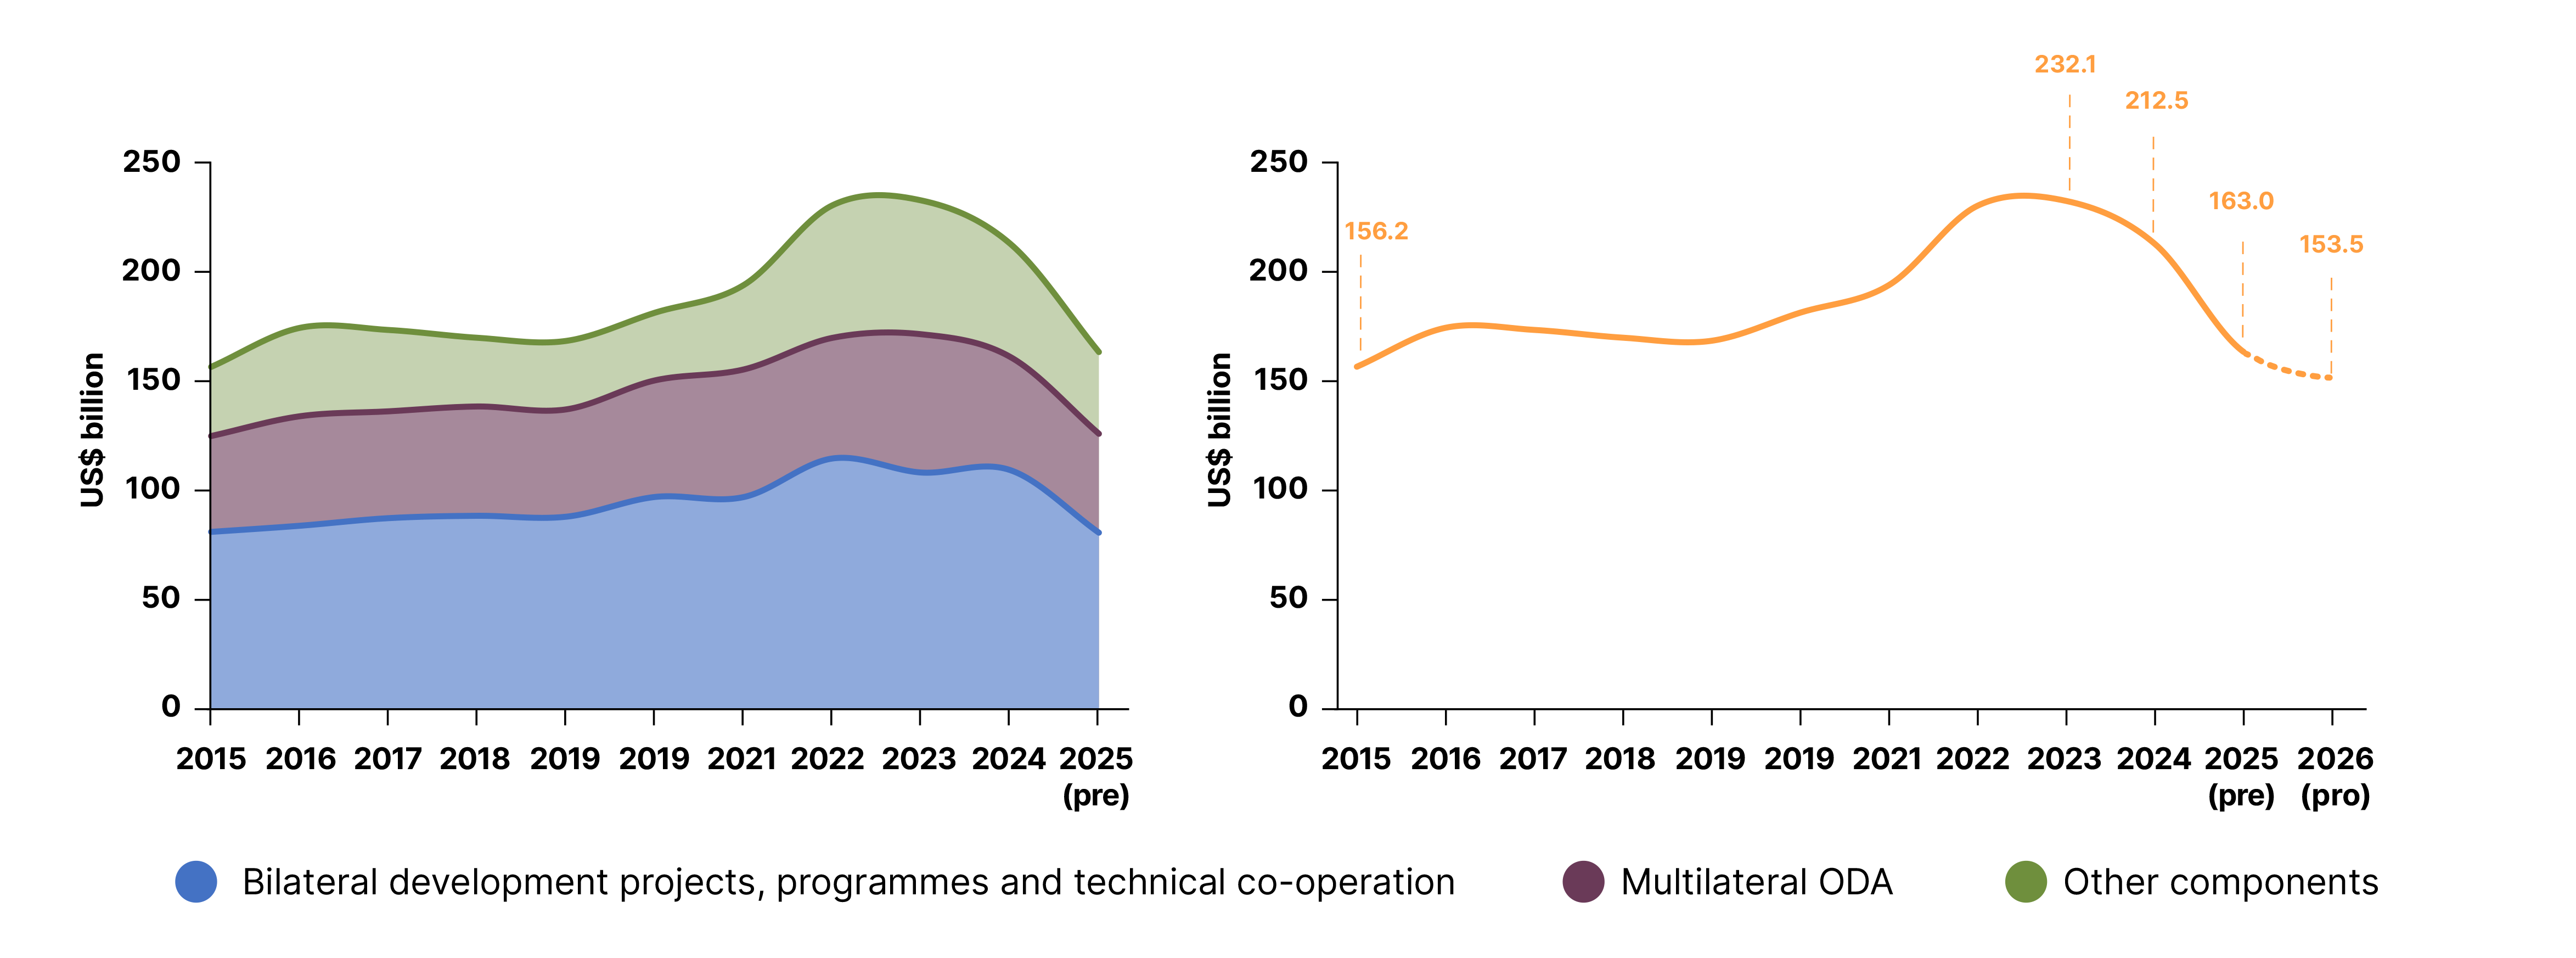
This final section of Chapter 1 broadens the perspective by situating the UNDS within the wider development funding landscape.46 Figure 27 presents total net ODA provided by OECD-DAC member countries from 2015 to 2024, along with preliminary 2025 values and projected 2026 figures (values are in real terms, expressed in constant 2024 US dollars).47 It also illustrates three of its components: The other panel in this figure illustrates three of its components: 1) Bilateral development projects, programmes and technical co-operation, 2) Multilateral ODA and 3) Other components, including humanitarian aid, in-donor refugee costs and net debt relief grants.
Between 2019 and 2023, net ODA from OECD-DAC members rose by 38.1% in real terms, largely driven by funding earmarked for crisis responses. During this time, most DAC members maintained or increased their ODA budgets in order to help developing countries address needs arising from the COVID-19 pandemic; respond to humanitarian emergencies such as the conflict in Ukraine; and deal with the costs of in-donor refugee assistance.48
Following five consecutive years of growth, however, net ODA fell from US$ 232.1 billion in 2023 to US$ 212.5 billion in 2024 – an 8.5% drop. Approximately, 86% of this US$ 19.7 billion reduction was driven by lower contributions to (including those channelled through) multilateral organisations, which declined from US$ 110.7 billion in 2023 to US$ 93.8 billion in 2024.
Preliminary data for 2025 indicate a 23.3% contraction in ODA, the largest annual decrease on record. Within multilateral funding, the data suggest that core contributions to the UNDS experienced the steepest decline at 27%. If these preliminary estimates are borne out, ODA in 2025 would fall below its 2016 level, reversing the growth seen over the past decade. Excluding additional pressures related to the current (at the time of writing) crisis in the Middle East, the OECD projects that 2026 will see a further 5.8% decline in ODA. This would mark three consecutive years of ODA contraction – an occurrence not seen since the end of the Cold War (1993–1995).49
Net ODA contributions from OECD-DAC countries, 2015–2024 (official data), 2025 (preliminary), and 2026 (projected)
Source: Organisation for Economic Co-operation and Development (OECD).
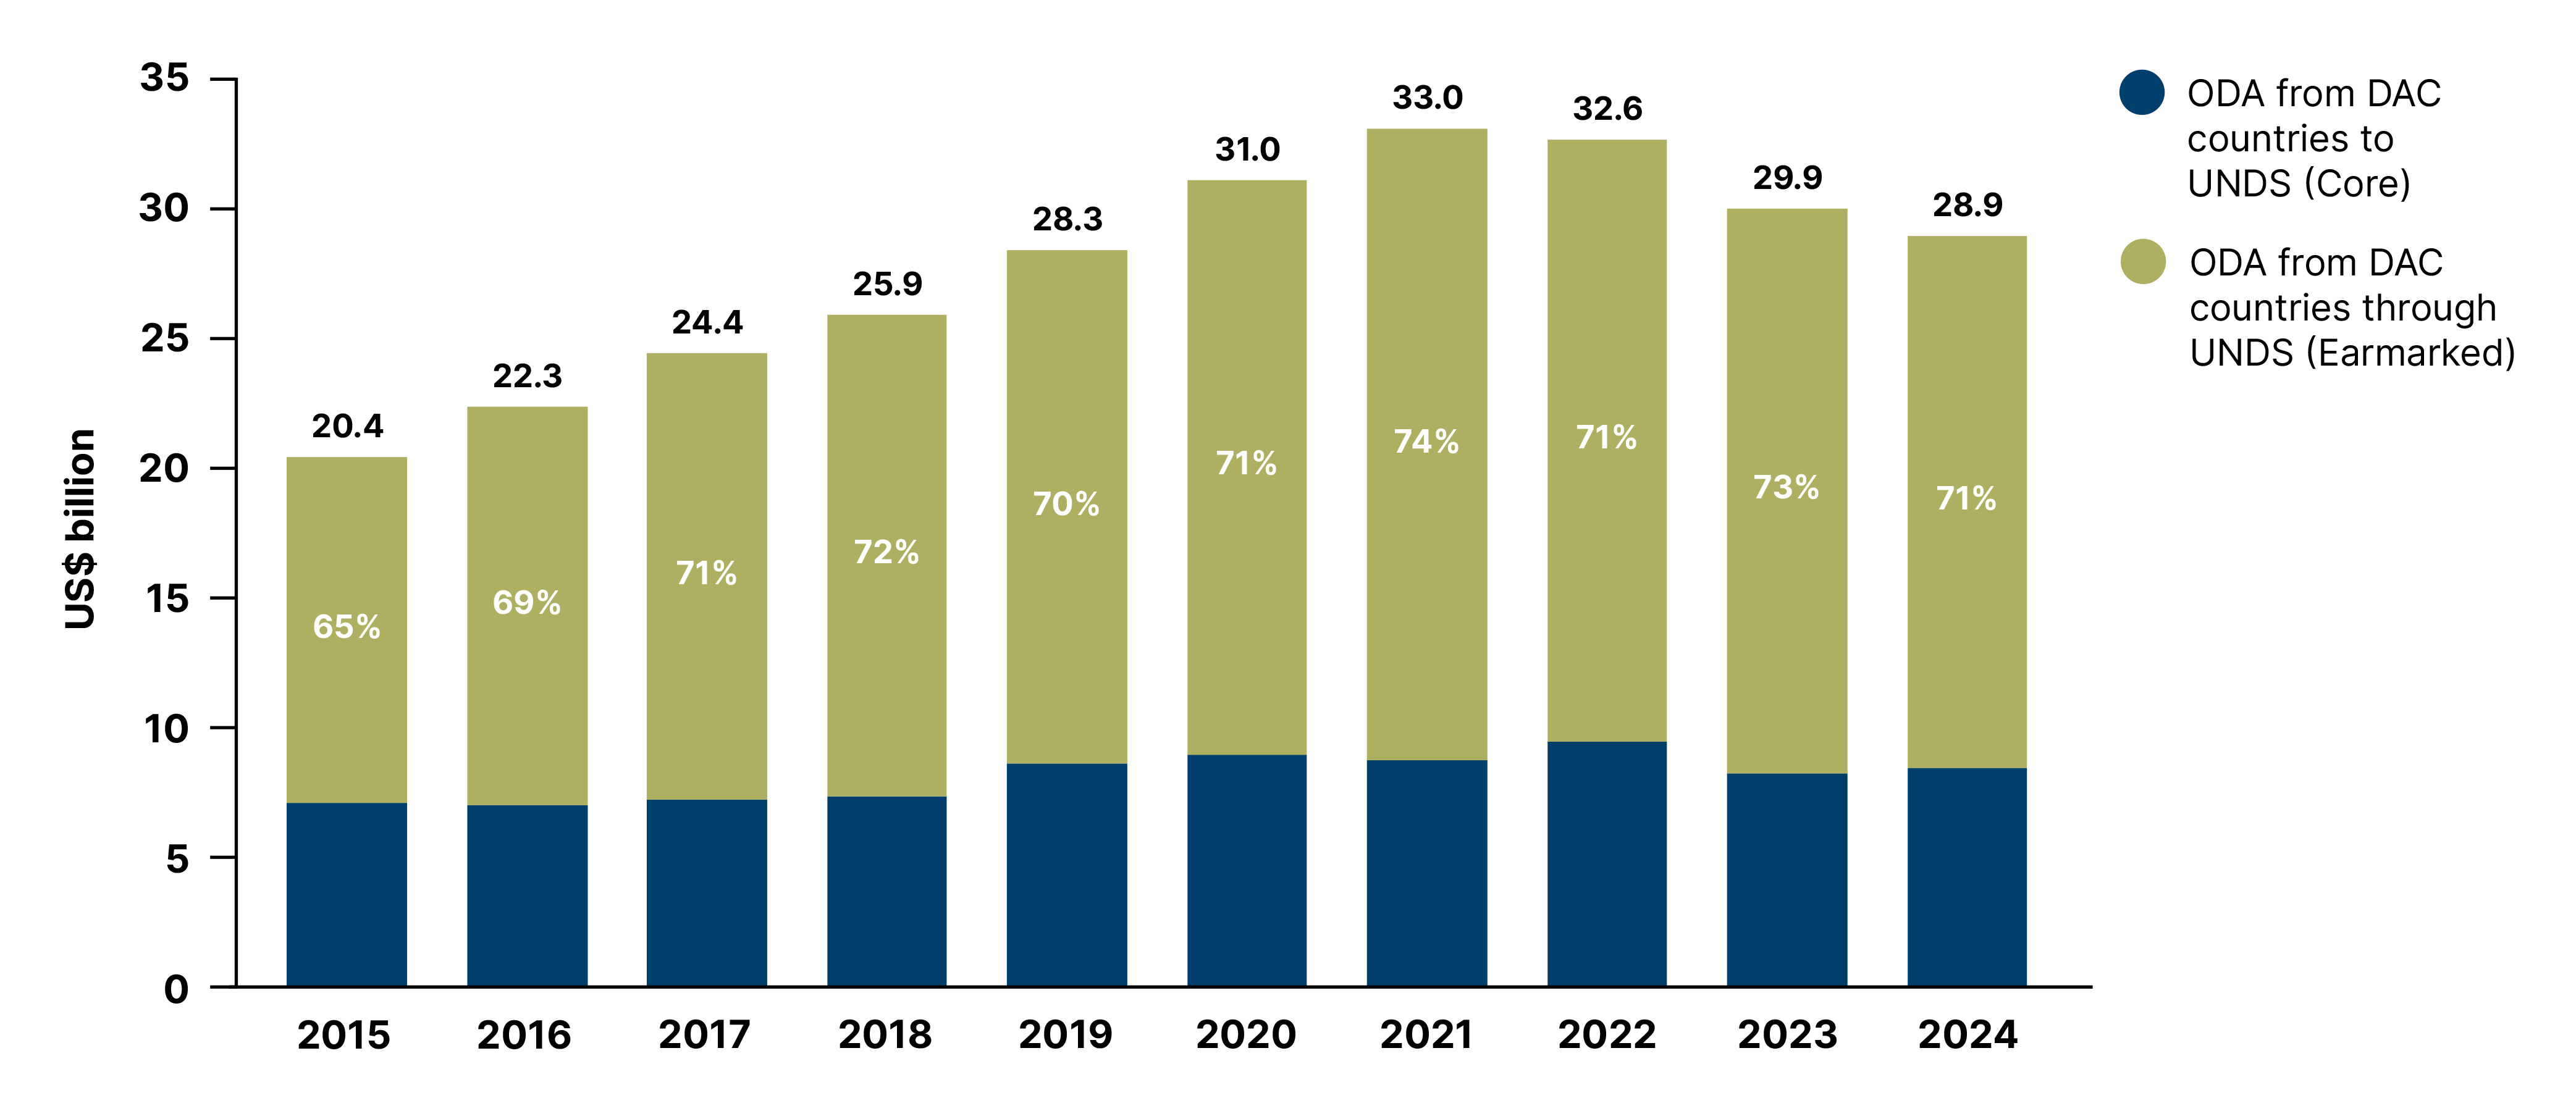
Figure 28 further disaggregates ODA from DAC countries to the UNDS, distinguishing between resources to UNDS (core contributions) and resources channelled through the UN system (earmarked contributions). Over the past decade, ODA from DAC members to the UNDS has been highly earmarked. In 2015, earmarked funding accounted for 65% of OECD-DAC countries’ funding to the UNDS, rising to a peak of 74% in 2021 before declining to 71% in 2024. OECD projections suggest core ODA contributions to the UNDS fell by 27% in 2025 – a US$ 2 billion drop to approximately US $6 billion.
ODA disbursements from DAC countries to the UN development system, 2015–2024 (US$ billion, constant 2024 prices)
Source: Organisation for Economic Co-operation and Development (OECD).
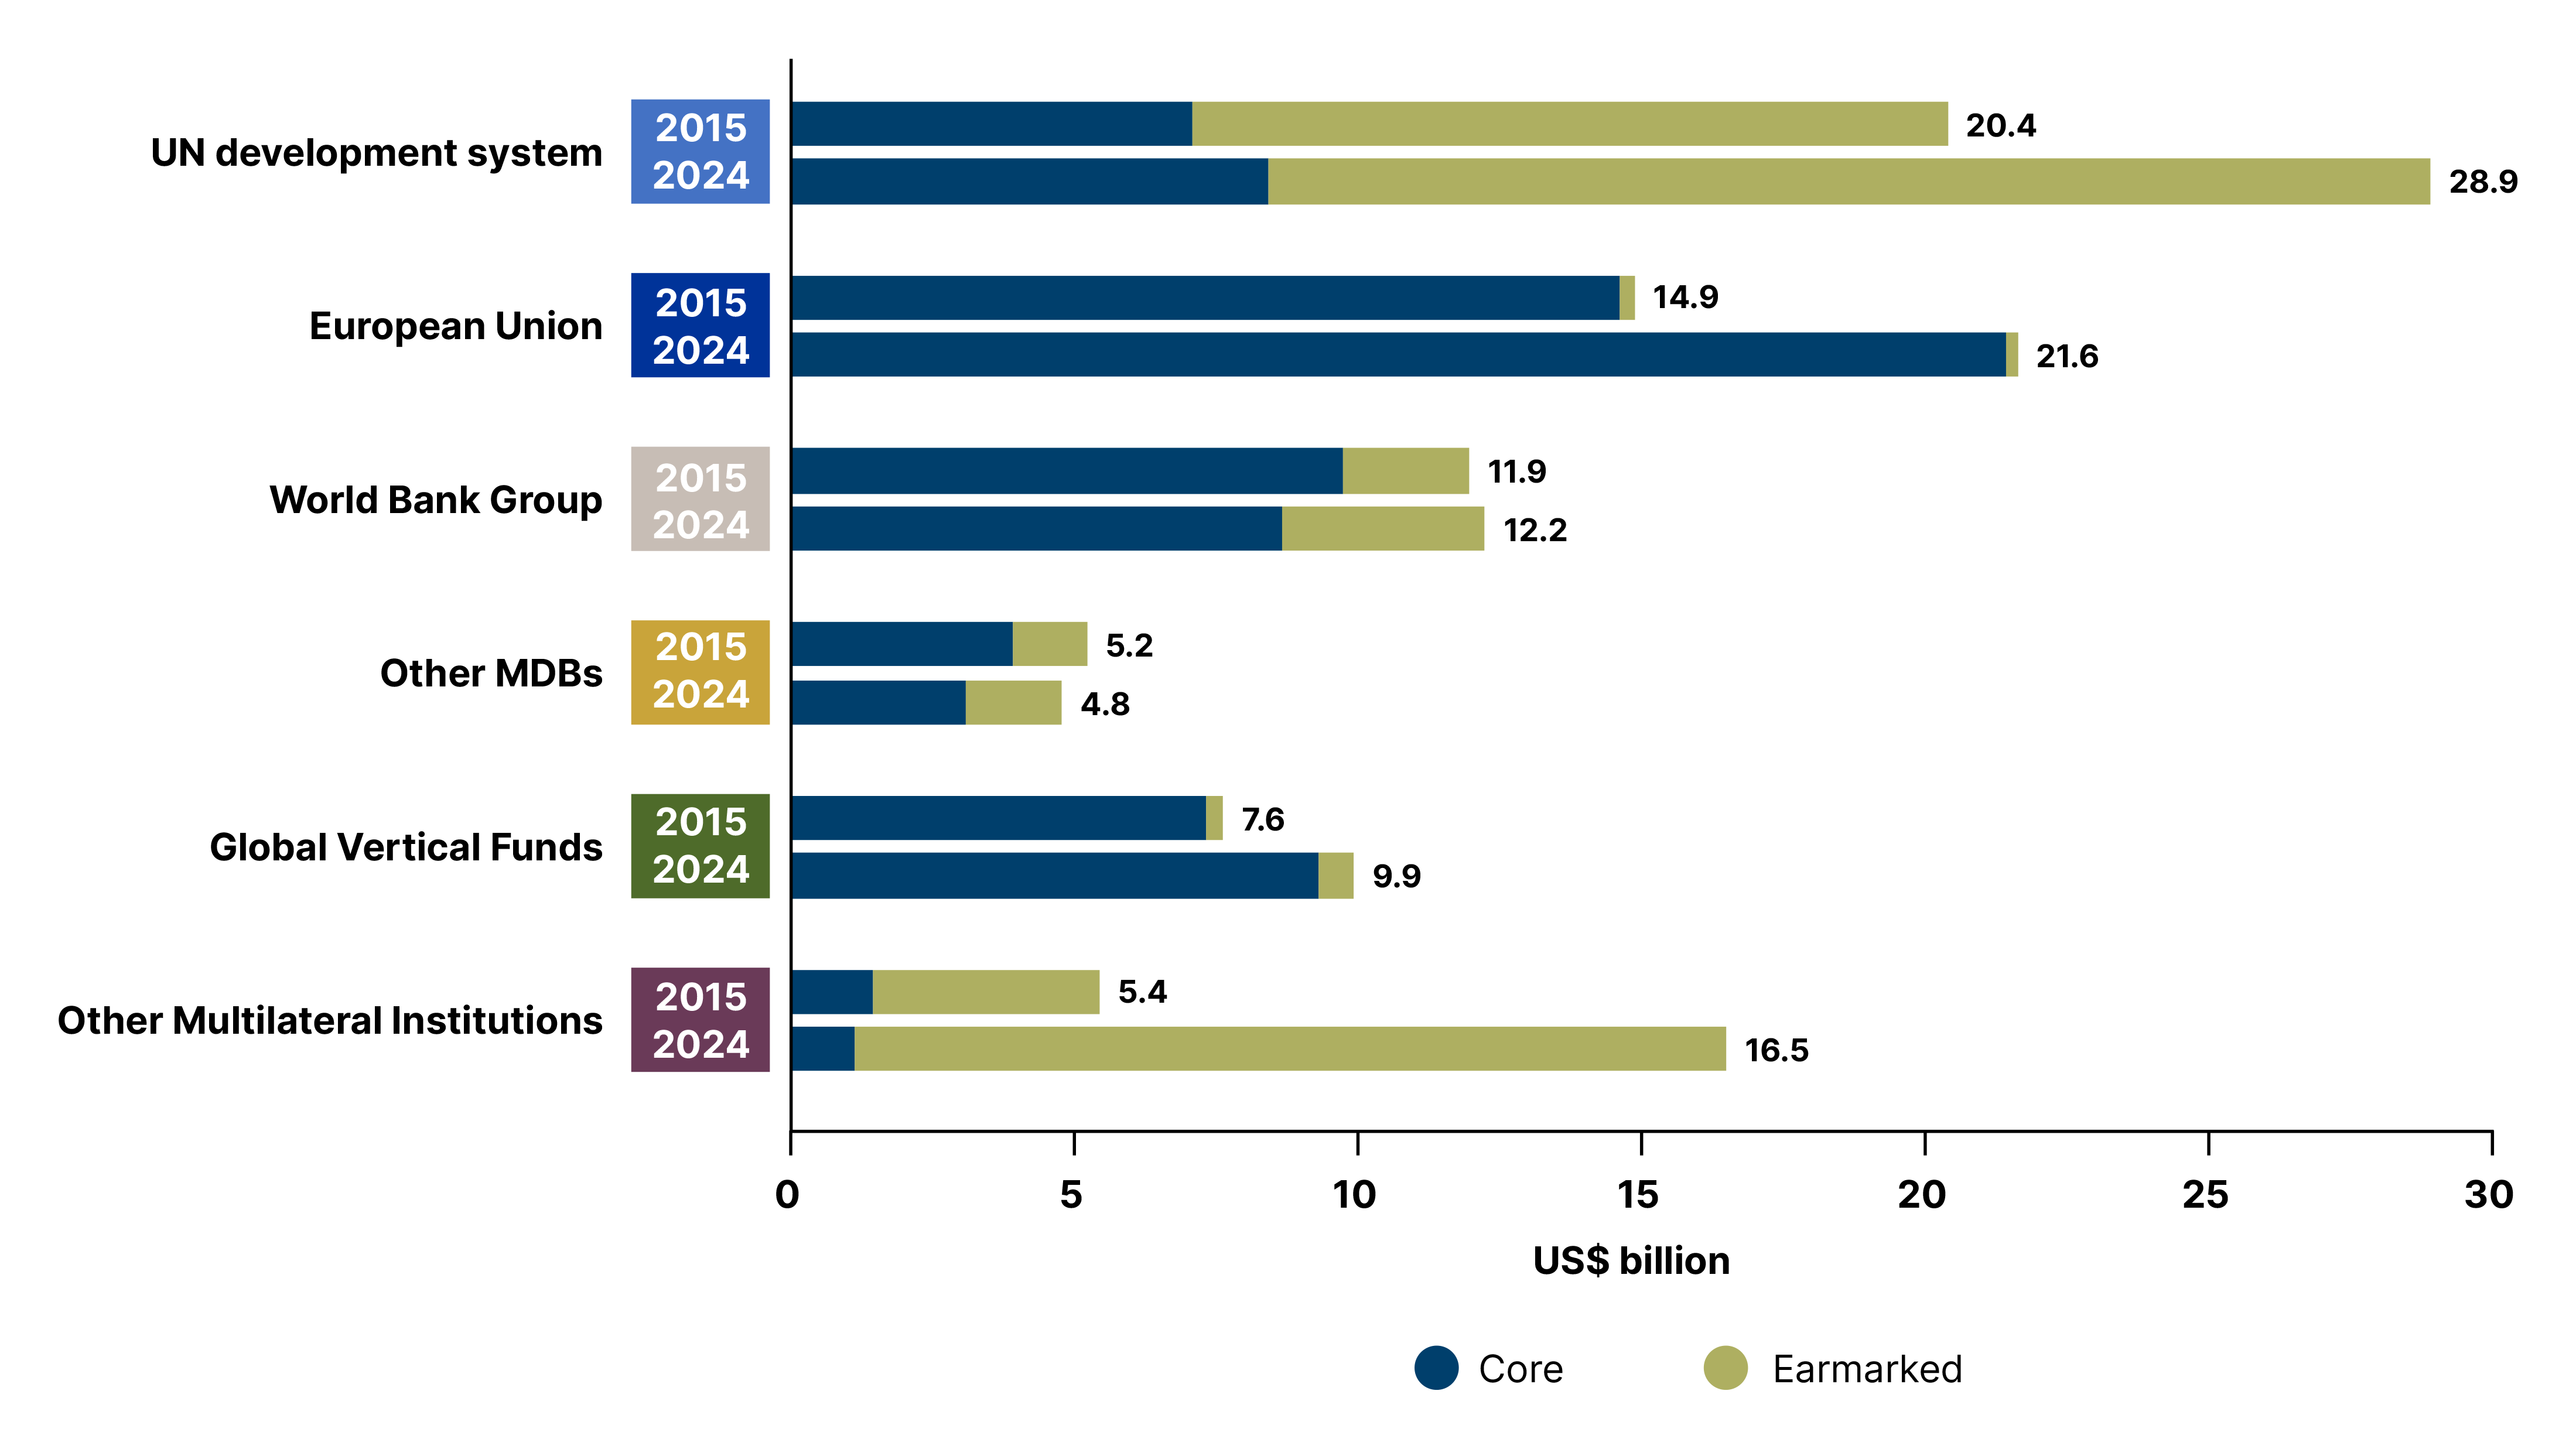
Figure 29 compares the volume of ODA from OECD-DAC members channelled to/through multilateral organisations – core and earmarked resources – in 2015 and 2024, highlighting how total volume and funding composition changed over the entirety of this period. The multilateral institutions are grouped in six categories: UNDS; the EU; the World Bank Group; other multilateral development banks (other MDBs); global vertical funds; and other multilateral institutions.50
Channels of multilateral assistance from OECD-DAC countries, core and earmarked, 2015 and 2024 (US$ billion, constant 2024 prices)
Source: Organisation for Economic Co-operation and Development (OECD).
Overall, there has been an expansion of ODA via multilateral assistance channels, with the UNDS receiving the largest volume of contributions. The EU stands out as the only major multilateral channel to have experienced a substantial increase in core funding, with total core resources rising from US$ 14.6 billion to US$ 21.4 billion over the period.
The UNDS also recorded significant growth, with total funding increasing from US$ 14.6 billion to US$ 21.4 billion in 2024. This expansion was driven primarily by growth in earmarked contributions, which rose from US$ 13.3 billion in 2015 to US$ 20.5 billion in 2024, accounting for 71% of total OECD-DAC funding. By comparison, the share of earmarked funding in 2024 was – with the exception of the ‘other multilateral institutions’ category – considerably lower for other multilateral channels, amounting to 6% for global vertical funds; 35% for other multilateral development banks; and 29% for the World Bank Group. These trends underscore the unique nature of UNDS’s continued heavy reliance on non-core funding sources.